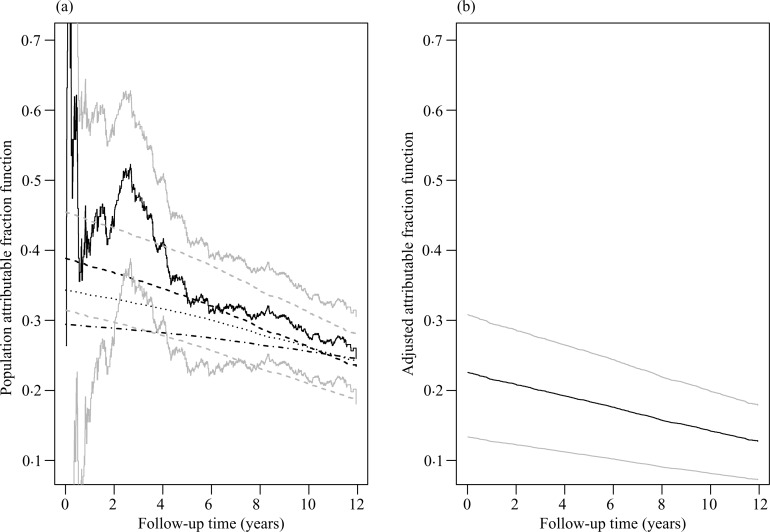
Fig. 2.
Estimation of attributable fraction functions for hypertension in the Cardiovascular Health Study. Panel (a) shows the estimates of the population attributable fraction function: the dark solid and dark dashed curves pertain to the point estimates by the nonparametric method and under the selected transformation model, respectively; the light solid and light dashed curves show the corresponding 95% confidence limits; the dotted and dash-dotted curves pertain to the point estimates under the proportional odds and proportional hazards models, respectively. Panel (b) shows the point estimate of the adjusted attributable fraction function and the corresponding 95% confidence limits.

