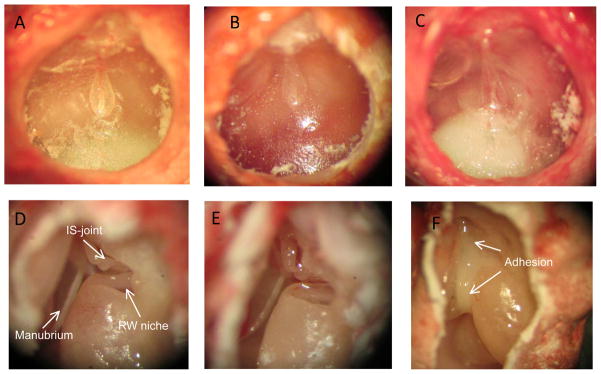
Figure 1.

Observations of tympanic membrane (TM) and ossicles in control and diseased guinea pig ears three days post inoculation. Upper panel: otoscopic photographs of TM in control (A), OME (B), and AOM ear (C). Lower panel: microscopic photographs of middle ear ossicles in control (D), OME (E), and AOM ear (F).
