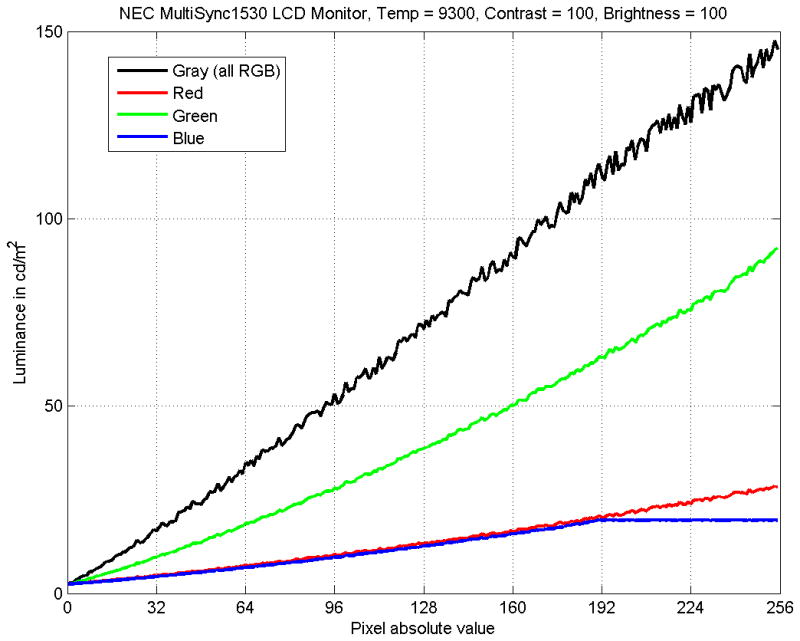
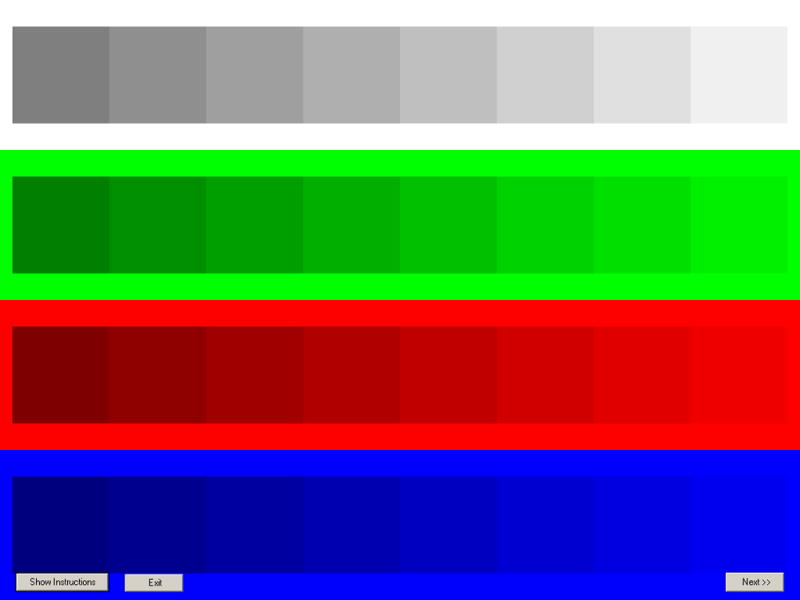
Figure 1.


(A). Luminance output of a LCD monitor where only one channel (blue) was saturated. The grayscale luminance (black) appears to be most “noisy” in the region of saturated-blue, but did not saturate itself. The data consists of one measurement at each pixel value for each color. The noise in the gray signal is photometer measurement noise and is the reason that we programmed the photometer-based procedure to take 10 samples at each RGB level. This figure is meant to illustrate saturation non-linearity and these data were not used to estimate gamma.
(B) Pattern for detecting and removing saturating non-linearity at high pixel values. Square patches of decreasing contrast against the bright background to detect saturation in grayscale and individual color channels. To remove saturating non-linearity, an observer adjusted the manual controls of the display device until all eight patches in each zone were visible, and the rightmost patch was just visible against the background. A similar stimulus was used for cut-off testing at low pixel values.
