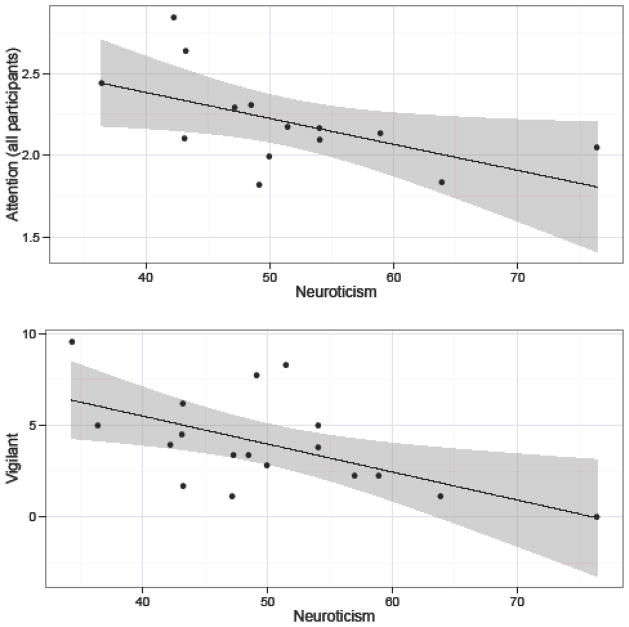
Figure 3.
Relationship between Neuroticism and average attention span (all participants) and time spent being vigilant. Neuroticism scores have been scaled as T-scores (M = 50, SD = 10). Vigilant behavior is expressed as the percent of time focal individuals were engaged in this behavior. Scores on attention span were calculated during cognitive testing sessions according to whether monkeys exhibited high (“3”), medium (“2”), or low (“1”) attention during trials; scores were averaged across trials for each individual (see Methods).

