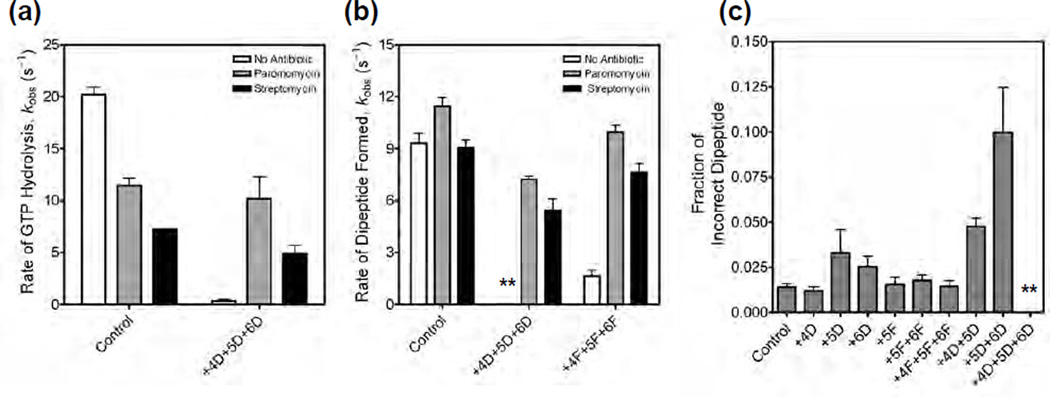
Figure 4. Effect of paromomycin and streptomycin on the rates of GTP hydrolysis and peptide bond formation.
(a) Bar graph showing the rates of GTP hydrolysis by EF-Tu ternary complex with the control mRNA and with the mRNA having three 2’-deoxynucleotide substitutions at positions +4, +5 and +6. Experiments were done in the absence of antibiotics (white bar), in the presence of paromomycin (grey bar) or in the presence of streptomycin (black bar). (b) Bar graph showing the rates of peptide bond formation with the control mRNA, with the mRNA having three 2’-deoxynucleotide substitutions at positions +4, +5 and +6, and with the mRNA having three 2’-fluoro substitutions at positions +4, +5 and +6. Labels for the bar graph are as indicated above. The asterisks are used to indicate that in the absence of antibiotics the rate of peptide bond formation was very slow with the triple 2’-deoxynucleotide substituted mRNA. (c) Bar graph showing the error frequency with 2’ -deoxynucleotide and 2’-fluoro substituted mRNAs. The asterisks are used to indicate that only negligible amounts of dipeptides were formed with the triple 2’-deoxynucleotide substituted mRNA. In all cases, the error bars represent s.d. from at least two experiments.

