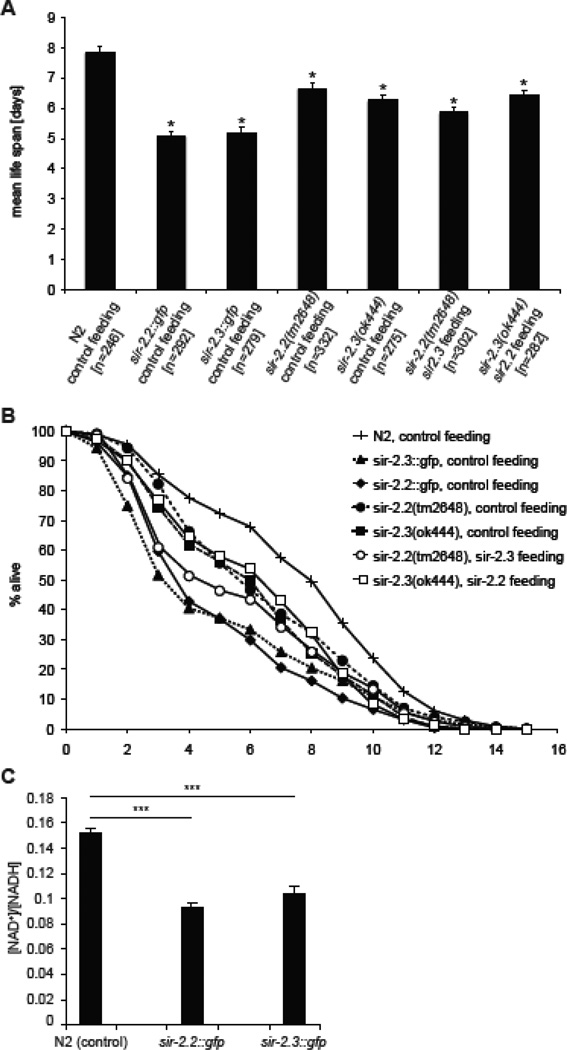
Fig. 2. C. elegans overexpressing or deficient in SIR-2.2 and/or SIR-2.3 show increased sensitivity to oxidative stress.
(A) Calculated mean life span of different worms grown at 24.5°C on RNAi feeding plates containing paraquat (200 µl of 250 mM paraquat solution added onto plate). Wild type (N2), worms overexpressing SIR-2.2 (sir-2.2::gfp) or SIR-2.3 (sir-2.3::gfp), worms mutant in sir-2.2 (sir-2.2(tm2648)) or sir-2.3 (sir-2.3(ok444) were fed on E. coli HT115(DE3) containing an empty L4440 vector (control feeding). Worms mutant in sir-2.2 (sir-2.2(tm2648)) were fed on E. coli HT115(DE3) containing a plasmid encoding for sir-2.3 (sir-2.3 feeding) and worms mutant in sir-2.2 (sir-2.2(tm2648)) were fed on E. coli HT115(DE3) containing a plasmid encoding for sir-2.2 (sir-2.2 feeding). At least 3 trials were conducted per strain. Error bars show standard error of mean (S.E.M.); asterisks indicate a significant difference (p-value < 0.001) to average life span of wild type (N2) worms; p-values were calculated using standard Student t-test; n: number of analyzed worms. (B) Average survival curves of the worm strains analyzed in (A). (C) Analysis of [NAD+]/[NADH] levels in whole worm lysates of wild type N2, sir-2.2::gfp and sir-2.3::gfp overexpressing worms. Error bars represent the standard error of mean; *** P<0.01 as compared with control animals (wild type N2 worms) using Student’s t-test.

