
Fig. 4.
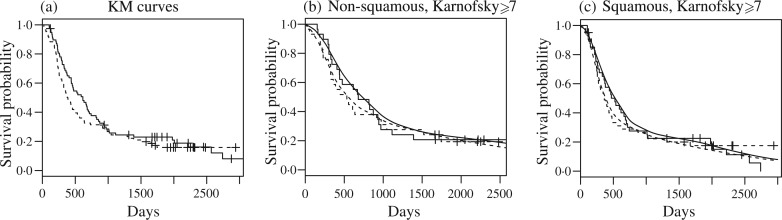
Lung cancer trial. (a) Kaplan–Meier estimates of survival functions. Solid lines refer to treatment and dashed lines refer to the control group. (b) and (c) The model-based estimates of survival curves arranged by cancer histology. For comparison, the corresponding Kaplan–Meier estimates are also included.