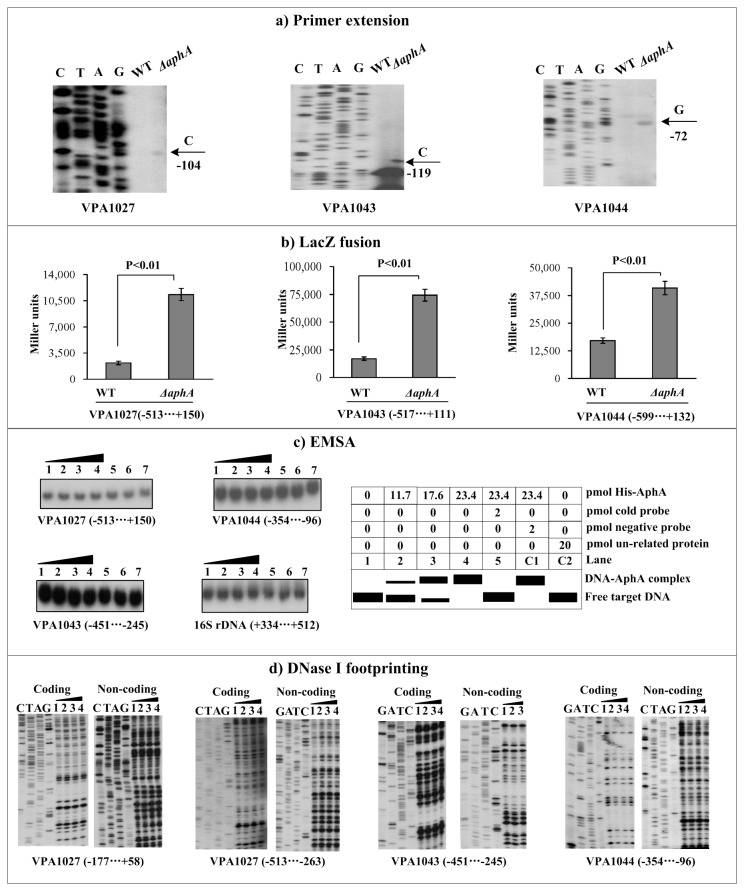
Figure 2. Regulation of T6SS2 genes by AphA.
Lanes C, T, A, and G represent the Sanger sequencing reactions. The minus and positive numbers indicated the nucleotide positions upstream and downstream of indicated genes. a) Primer extension. An oligonucleotide primer was designed to be complementary to the RNA transcript of each gene tested. The primer extension products were analyzed with an 8 M urea-6% acrylamide sequencing gel. The transcriptional start sites were indicated by arrows with nucleotides and positions. b) LacZ fusion. The target promoter-proximal DNA region was cloned into the lacZ transcriptional fusion vector pHRP309 and then transformed into WT or ΔAphA to determine the promoter activity, i.e., the β-galactosidase activity (miller units) in the cellular extracts. c) EMSA. The radioactively labeled promoter-proximal DNA fragments were incubated with increasing amounts of purified His-AphA protein and then subjected to 4% (w/v) polyacrylamide gel electrophoresis. If there was the association of His-AphA and target DNA, the band of free DNA disappeared with increasing amounts of His-AphA, resulting in a retarded DNA band with decreased mobility, which presumably represented the DNA-AphA complex. Shown also was the schematic representation of the EMSA design. d) DNase I footprinting. Labeled coding or non-coding DNA probes were incubated with increasing amounts of purified His-AphA (Lanes 1, 2, 3, and 4 containing 0, 35.1, 46.8, and 58.5 pmol, respectively) and then subjected to DNase I footprinting assay. The footprint regions were indicated by vertical bars with positions.

