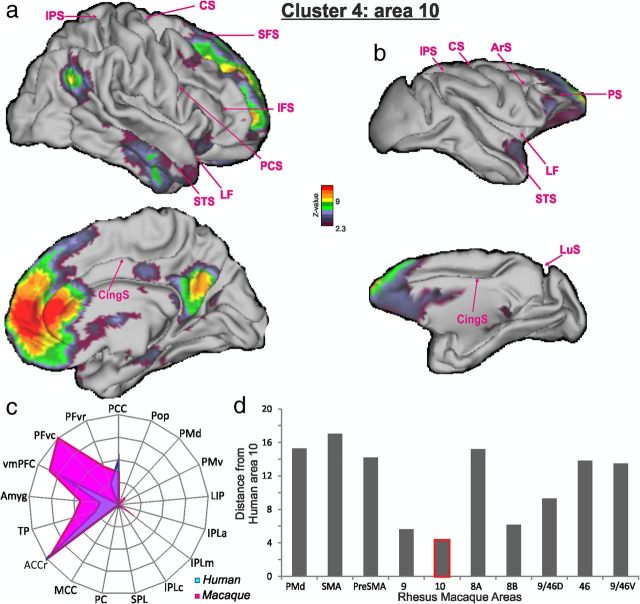
Figure 8.
Cluster 4/area 10. a–c, The BOLD coupling patterns of cluster 4 in human subjects (a) and area 10 in macaques (b) and their associated functional connectivity fingerprints in humans and macaques (c). d, The summed absolute differences between the functional coupling scores suggested that human cluster 4 resembled macaque area 10 (lowest bar). All other conventions are as in Figure 5.

