Fig. 3.
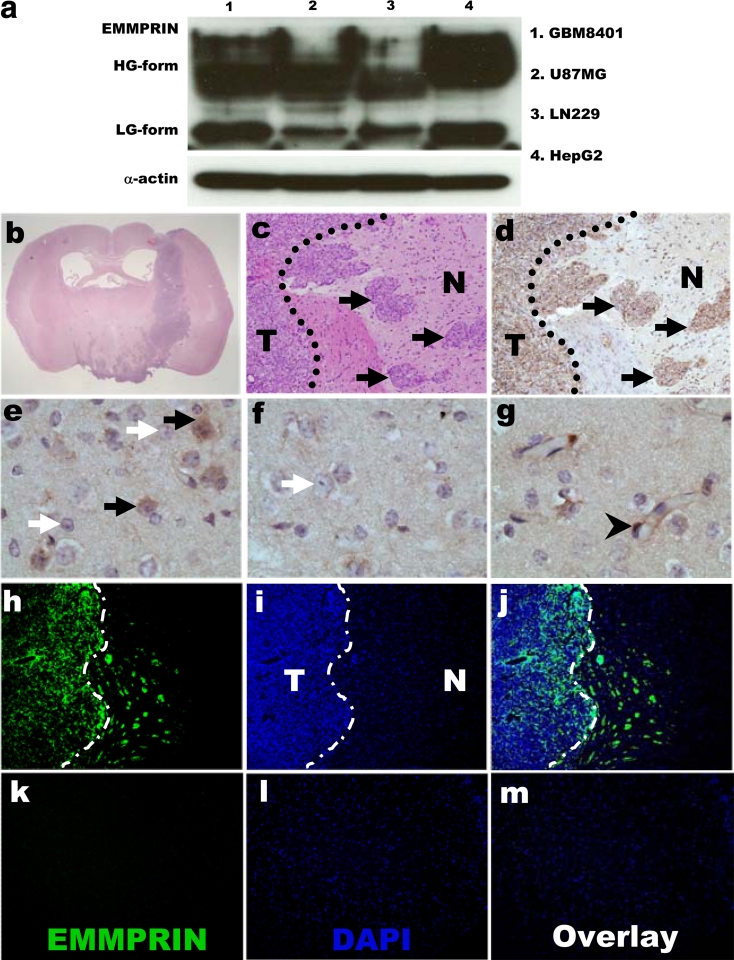
Western blot analysis of astrocytomas cell lines, and histopathologic staining of EMMPRIN-expressing in GBM8401 glioma xenografts. a Western blot analysis of EMMPRIN expression in GBM8401, U87MG, LN229 glioma cells, and positive control HepG2 hepatoma cell line. EMMPRIN protein production consisted of HG high glycosylation, and LG low glycosylation forms. The expression of α-actin was used as internal control. Hematoxylin and eosin staining of GBM8401 glioma xenograft in b coronal section of the brain and c tumor–brain interface. d Immuno-histochemical staining revealed EMMPRIN-expressing invasive tumor islands (black arrows). e–g The normal control of astrocytes (black arrows), oligodendrocytes (white arrows), and endothelial cells (black arrow head). In the immuno-fluorescence staining with antibodies specific for EMMPRIN, h FITC-labeled EMMPRIN-expressing GBM8401 glioma cells were distributed near the invasive front at the tumor–brain interface (dash line) with some invasive tumor islands away from the main tumor mass. k The contralateral normal control of brain astrocytes showed only faint FITC fluorescence. i, l DAPI-stained nuclei. j, m The merged photos of FITC-labeled EMMPRIN expressing tumors and DAPI-stained nuclei. Original magnification ×100. Data were representative of three independent experiments. T tumor, N neighborhood brain parenchyma. Original magnification ×12.5 (b); ×200 (c, d); ×1,000 in (e–g); and ×100 (h–m). (Color figure online)

