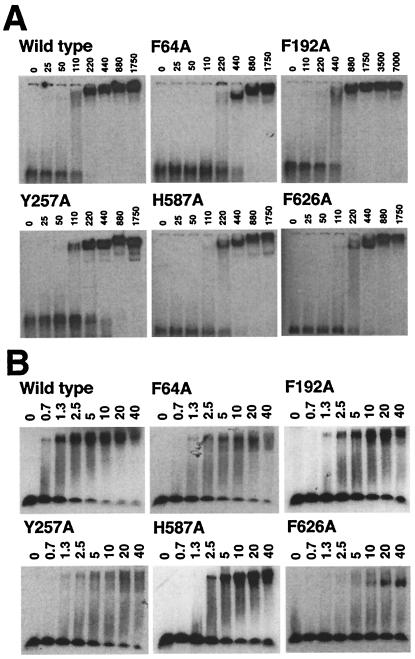
Figure 3.
Electrophoretic mobility-shift assays. (A) ssDNA band shifts. A total of 2.5 nM dT16 was incubated with protein at the nanomolar concentration indicated (see Materials and Methods). (B) Duplex DNA band shifts. A 22-bp blunt end duplex at 2.5 nM was incubated with protein at the micromolar concentration indicated (see Materials and Methods).

