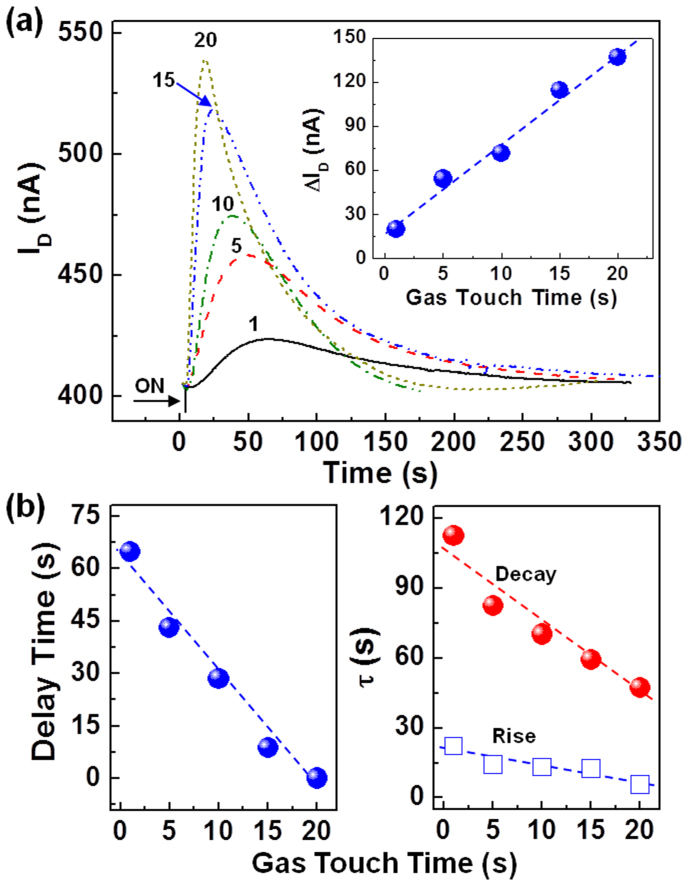
Figure 3. Effect of nitrogen gas applying time.
(a) Change of drain current (ID) as a function of time in the LC-on-OFET sensory devices upon applying nitrogen gas flows to the LC surface, where the intensity of nitrogen gas flows was fixed as 33 μl/s (2 sccm) but the applying time was varied from 1 s to 20 s; Inset shows the change of maximum (peak) ID as a function of nitrogen gas flow applying time. (b) Change of delay time (left) and time constants (right) as a function of nitrogen gas flow applying time: The delay time is defined as the time (of the increasing ID trend) to reach a maximum (peak) value even after stopping the nitrogen gas flows, while the rise/decay time constants were obtained by fitting with a single exponential equation (see the details in the experimental part). Note that the minus (−) sign in ID was omitted to avoid crowding data display.

