
Figure 2.
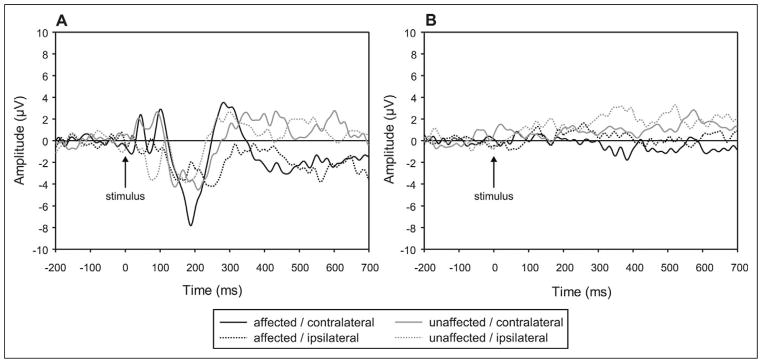
Comparison of cortical responses to air puff and sham control stimulation. (A) Air puff stimulation. (B) Sham control stimulation. All tracings represent grand averaged waveforms of all patients across all valid trials. Stimulus occurs at time 0 ms; background EEG shown before stimulus. Each tracing represents a specific hand (affected or unaffected) being stimulated and its corresponding response in the cortex (ipsilateral or contralateral to the stimulation).