Figure 1.
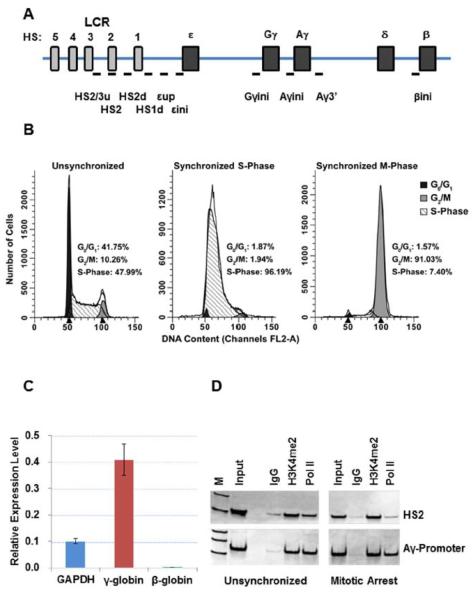
A. Diagram of the human β-globin gene locus indicating the position of genes and LCR HS sites. Small bars indicate the position of PCR-amplicons analyzed in this study. These regions are as follows: HS2/3/u, two sets of primers in the linker region between HS3 and HS2; HS2, core region of HS2; HS2d, a region between HS2 and HS1; HS1d, a region downstream of HS1; εup, a region between HS1 and ε-globin; εini, a region overlapping the transcription initiation site of the ε-globin gene; Gγini, a region overlapping the transcription start site of the Gγ-globin gene; Aγini, a region overlapping the transcription start site of the Aγ-globin gene; Aγ3', a region at the 3'end of the Aγ-globin gene, βini, a region overlapping the transcription start site of the β-globin gene. B. Flow cytometry analysis of unsynchronized, synchronized at the G1/S-phase border, and M-phase arrested K562 cells. The cells were arrested at the G1/S-phase border (labeled as Synchronized S-Phase) using the double thymidine method, then released from the block and arrested in M-phase using nocodazole (labeled as Synchronized M-Phase). C. Analysis of GAPDH, γ-globin, and β-globin gene expression by reverse transcription (RT) qPCR. The data represent means +/− standard error of the means of results from two experiments. D. ChIP analysis of of the interaction of H3K4me2 and Pol II with HS2 and the Ay-globin promoter (Aγini). ChIP enriched DNA was amplified with the indicated primers and electrophoresed on TBE gels followed by staining with SYBR green.

