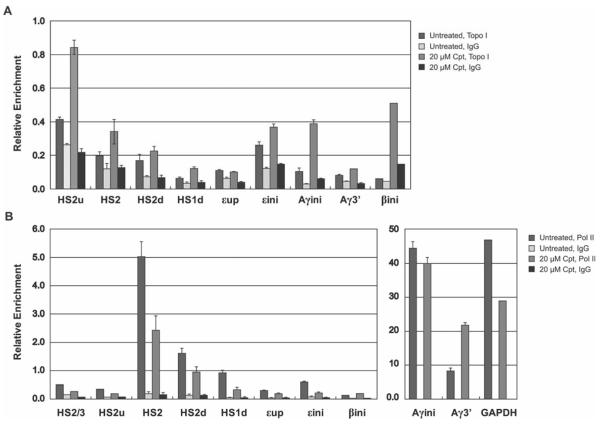
Figure 4. Analysis of Topo I and Pol II binding with specific region in the β-globin gene locus in camptothecin treated K562 at late S-phase.
Quantitative PCR results of ChIP assays of Topo I (upper graph) and Pol II (lower graph) binding to the β-globin locus in synchronized K562 cells, untreated (no drug) or treated with 20μM of camptothecin (Cpt) for 1hour. Cells were cross-linked with formaldehyde and the chromatin was isolated, fragmented, and precipitated with antibodies against Topo I, Pol II, or the unspecific IgG antibody. DNA was purified from the precipitate and analyzed by quantitative PCR using primers specific for the indicated regions in the LCR, intergenic region, and promoters of ε-globin, γ-globin, and β-globin in the β-globin locus (the amplicons are indicated in the diagram shown in Fig. 1A: HS2/3, LCR HS2 and HS3 linker region; HS2u, HS2 5' flanking region; HS2, HS2 core; HS2d, HS2 downstream region; HS1d, HS1 downstream region; εup: ε-globin gene upstream region; εini, ε-globin promoter; Aγini, Aγ-globin promoter; Aγ3', Aγ-globin gene 3' region; βini, β-globin promoter; GAPDH, GAPDH promoter region.). Bars represent the relative enrichment over the input DNA. Error bars represent standard deviation from two independent experiments.

