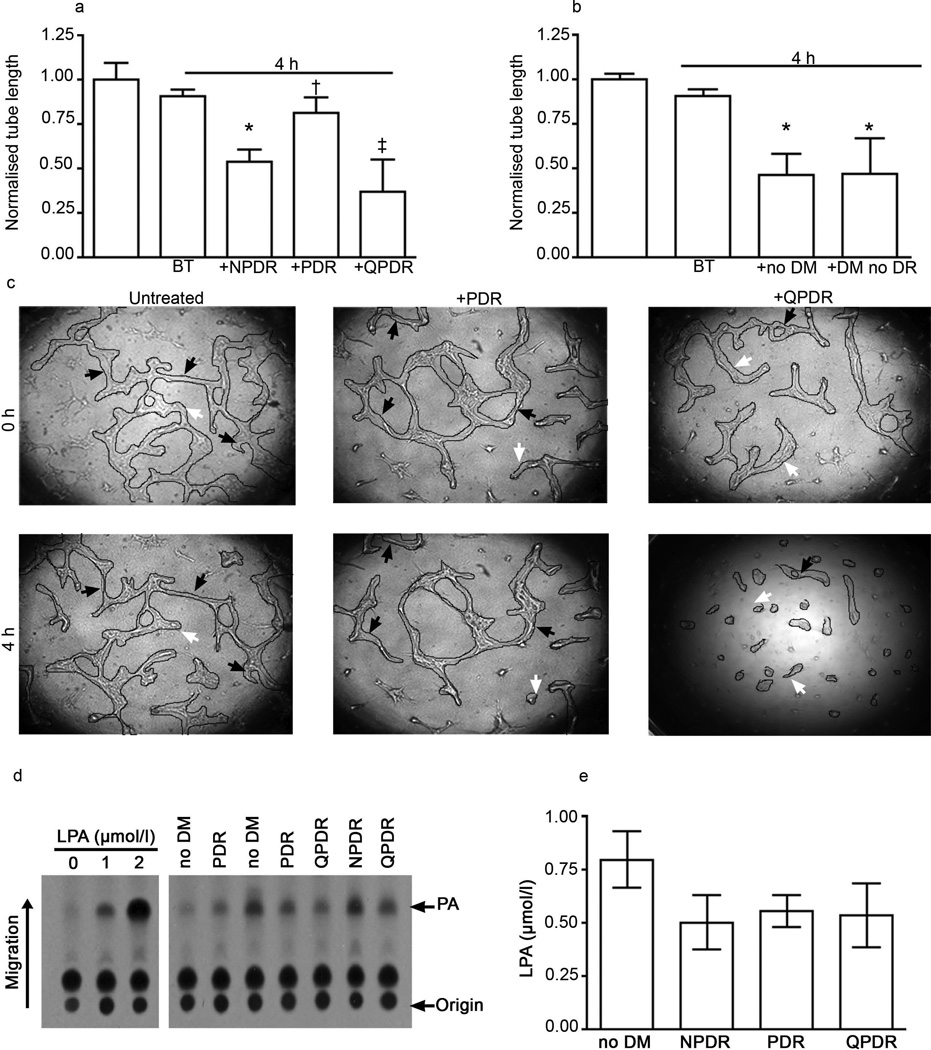
Fig. 4.
PDR vitreous contained LPA, but failed to promote regression. (a) Tubes were formed as described in the legend to Fig. 2. Vitreous from patients with the indicated stage of DR was added after tubes had formed and regression was assessed 4 h later. Representative photos are shown in (c). Three specimens of each type were analysed. Data shown are means±SEM. *p<0.05 vs control. (b) Regression activity for non-angiogenic vitreous specimens. Samples from no DM and DM no DR patients induced significant regression (*p<0.05 vs control) of the tubes; n=3 and n=4, respectively. Normalised tube length is the ratio of final and initial tube lengths. (d) LPA was quantified in vitreous from patients with different stages of DR (n=3 for NPDR and QPDR, n=4 for PDR) or no DM (n=3). (e) Quantification of vitreous LPA. Data shown are means±SEM. There were no differences in the level of LPA between the groups

