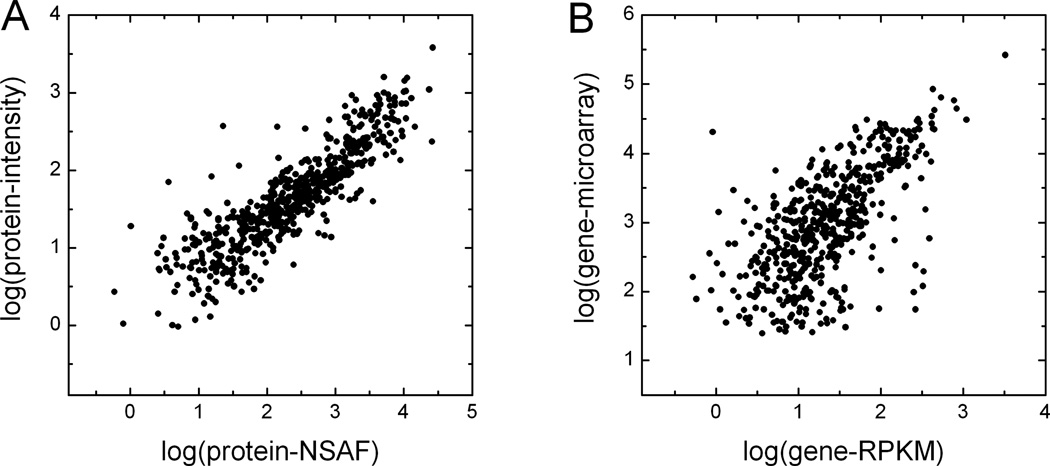
Figure 3. Comparison between different quantitative measures at gene and protein levels.
(A) Protein abundance estimates by MS2 spectral counts (NSAF) plotted against protein abundance estimates from MS1 intensity data by msInspect, log transformed. Data for mitochondrial genes in brainstem tissue. Protein abundance by msInspect is based on top 3 normalized peptide area intensities. (B) Correlation of gene expression based on RPKM by mRNA-Seq and based on microarrays, log transformed.

