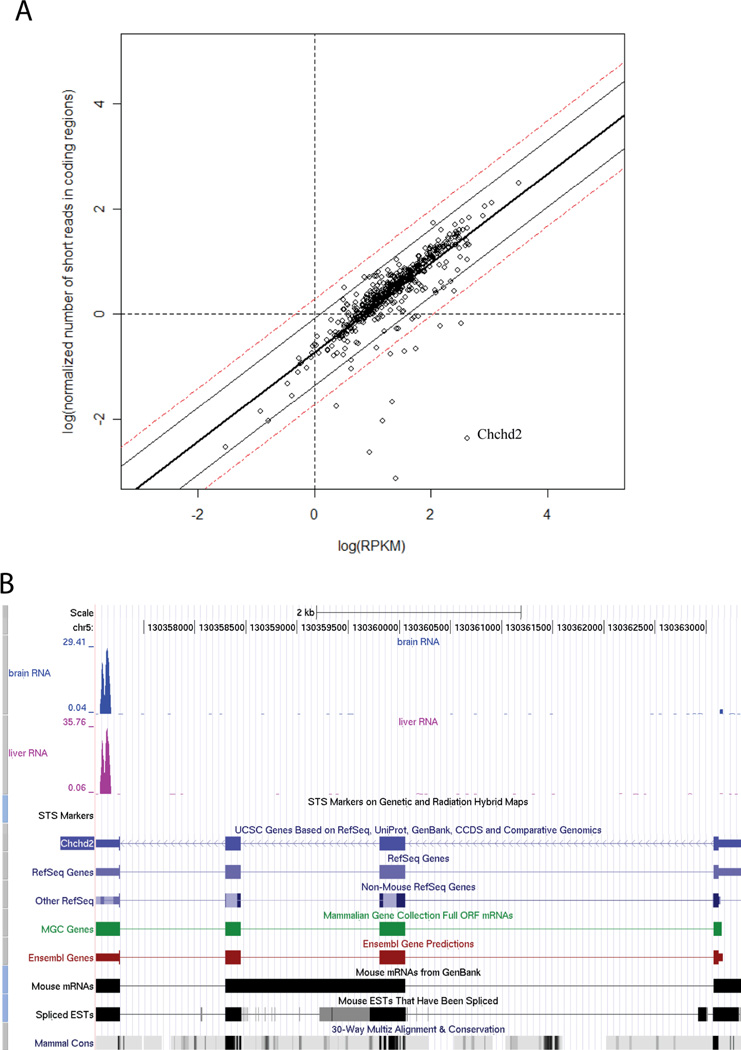
Figure 5. The analysis of the “coding region dominant” genes and selected example.
(a) Comparison of normalized number of short reads in coding regions (log transformed) and log(RPKM). Data for mitochondrial genes in brainstem tissue. The number of short reads in coding regions is normalized and it is always smaller than RPKM for the same gene. The boundaries of 90% and 99% confidence intervals are shown in solid and dashed lines. (b) The screen shots of UCSC genome browser of the outlier gene Chchd2. Most of the short reads for this gene are aligned to untranslated regions.

