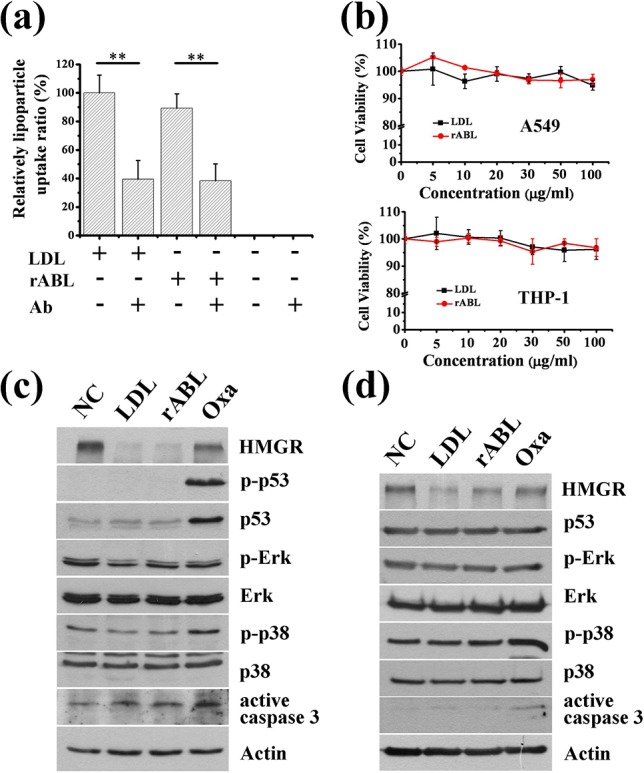
Figure 3.

(a) LDLR competition test results of LDL and rABL. In this experiment, approximately 200 cells were collected for each condition, and LDL-stained cells were counted. PBS was used as additive control. **P < 0.01. (b) Cell viability assay of LDL- and rABL-treated A549 (upper) and THP-1 (lower) cancer cell lines at various concentrations. For clearly presenting these data, the X-axis of both figures are not in the linear scale. Western blot analysis of HMGR, and oxidative stress response proteins p53, p38, and Erk; and apoptosis response factor caspase 3 in (c) A549 and (d) THP-1 cells treated with LDL and rABL for 11 h (left panel). NC, untreated control; Oxa, oxaliplatin.
