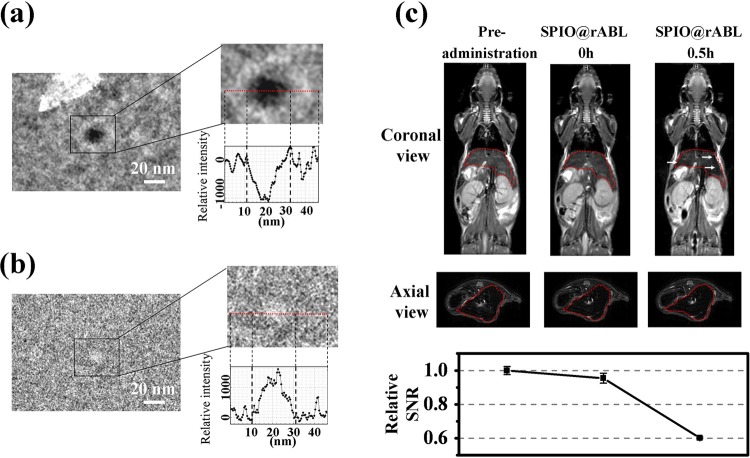
Figure 6.
(a) SP-HRTEM was used to identify SPIO@rABL. SPIO@rABL contains a high electron density (scale bar is 20 nm). (b) LDL particle observed as a control is indicated with a black dot circle (scale bar is 20 nm). The red lines of a and b denote the relative imaging intensity. (c) In vivo imagining pattern of coronal view (upper panel) and axial view (middle panel) of SPIO@rABL contrast enhanced MRI in mice liver. The SPIO@rABL 0.5-h MRI image compared mice in the preadministration state, whereas SPIO@rABL at 0 h showed signal reduction (arrows) in liver (red circle) after SPIO@rABL administration to mice. Relative SNR was determined by computer-assisted analysis of MR images (lower panel). For each mouse, 3 images were analyzed and mean of SNR was determined. The average SNR of preadministration mice was 16.96 ± 0.41.

