
Figure 8.
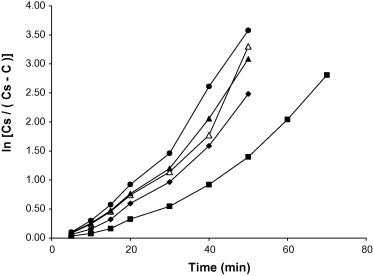
Ln [Cs/(Cs − C)] versus time plots for chloroquine phosphate tablet formulations containing 5.00% w/w of starch binder: ♦, Bitter; ■, Chinese; ●, Water; ▴, White; △, Corn.
Official websites use .gov
A
.gov website belongs to an official
government organization in the United States.
Secure .gov websites use HTTPS
A lock (
) or https:// means you've safely
connected to the .gov website. Share sensitive
information only on official, secure websites.
Ln [Cs/(Cs − C)] versus time plots for chloroquine phosphate tablet formulations containing 5.00% w/w of starch binder: ♦, Bitter; ■, Chinese; ●, Water; ▴, White; △, Corn.