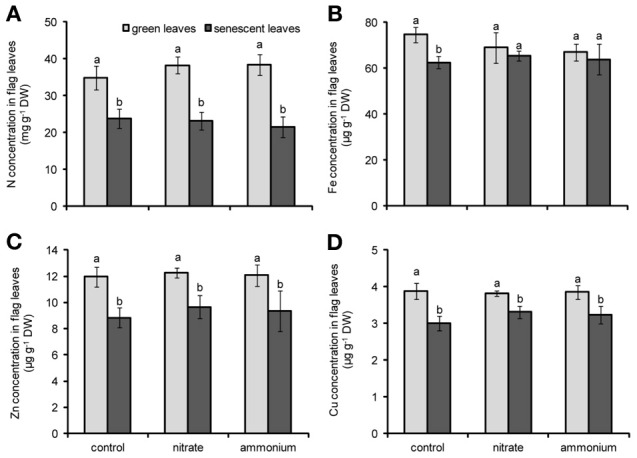
Figure A1.

Concentrations of N (A), Fe (B), Zn (C), and Cu (D) in flag leaves of winter wheat as affected by nitrate- or ammonium-based fertilization (80 kg N ha−1) at anthesis (EC65). Bars represent the means of 4 independent replicates ± SD, and 4 plants per replicate. Means followed by different letters indicate significant differences between treatments according to Two-Way ANOVA followed by Tukey’s test (P ≤ 0.05).
