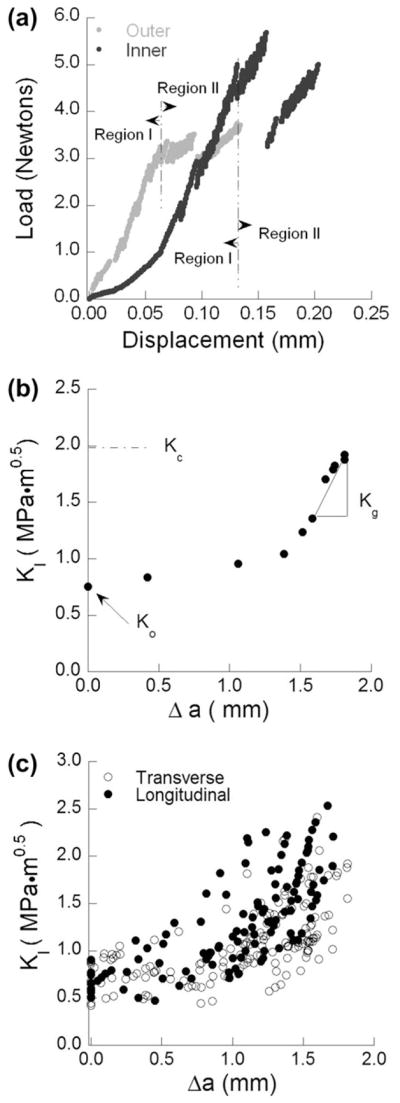
Fig. 3.

Stable crack extension in the inset CT enamel specimens. (a) Load vs. load-line displacement distributions obtained for specimens of inner and outer enamel during stable crack extension in the transverse direction. Region I denotes preloading and Region II distinguishes the portion of response associated with incremental crack extension. (b) Crack growth resistance curve (i.e. R-curve) for crack extension within the inner enamel. The quantities K0, Kg and Kc represent the initiation toughness, growth toughness and fracture toughness, respectively. (c) R-curves for all specimens in the longitudinal and transverse directions.
