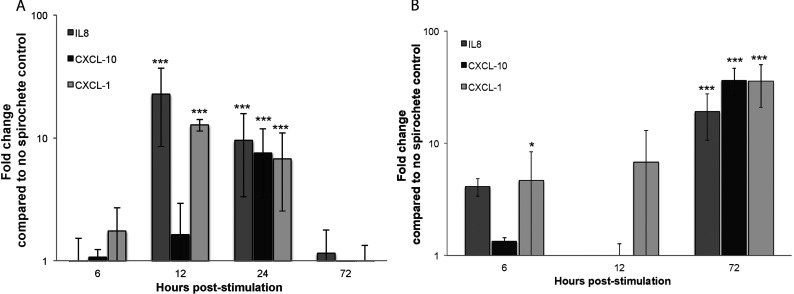
Figure 1. Validation of selected genes among those found to be differentially regulated by QPCR array analysis.
(A) Primary human astrocytes. (B) Primary HBMEC; all cells were stimulated with B. burgdorferi for 6–72 h. RNA was extracted and cDNA synthesized. Individual primer sets (SABiosciences) were used to amplify transcripts of interest by QPCR. Data represent at least two biological replicates per time point, with each PCR reaction run in triplicate. Expression levels of all transcripts were compared with housekeeping genes and the relative changes in gene expression were compared with those of untreated cells using the 2−ΔΔCT method, and are expressed as fold change compared with no spirochete control. Error bars represent S.E.M.

