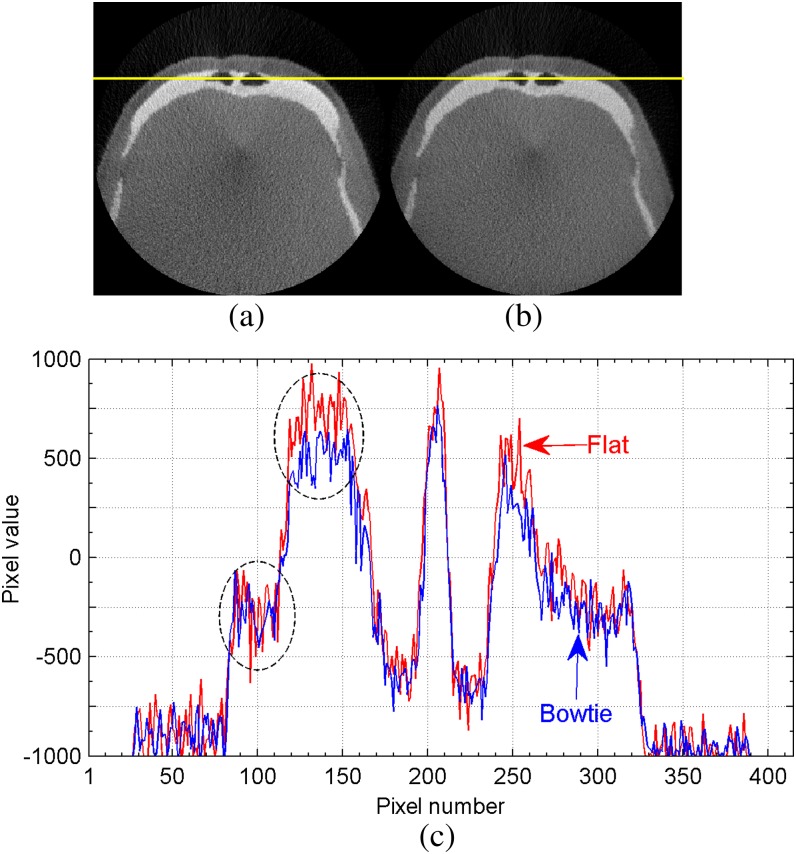
Figure 12.
A typical reconstructed axial image of the Zubal phantom with (a) the original flat filtration, (b) the bowtie filtration and (c) comparison of a selected line profile across the image. The line in (a) and (b) indicates the position of the profile, and the dashed circles in (c) indicate the selected region for use in contrast-to-noise ratio calculation. Arrows indicate the flat and bowtie filtrations.

