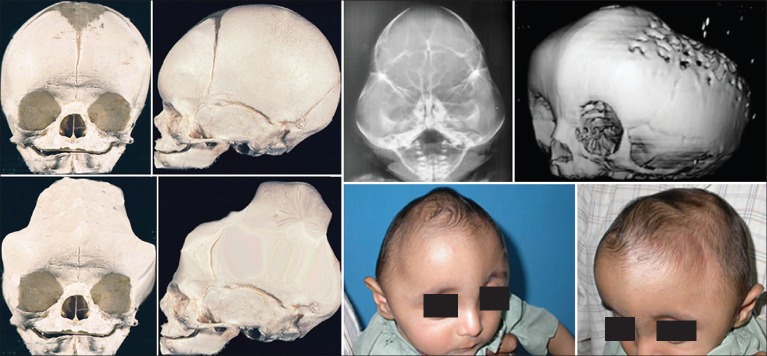
Figure 8.

Schematic pathogenesis of clover leaf deformity (upper row). Plain X-ray skull and 3D computed tomography (CT) showing the deformity the CT also shows thinning of the calvarium because of raised intracranial pressure (middle row). The lower row shows clover leaf deformity in a 9 months old child
