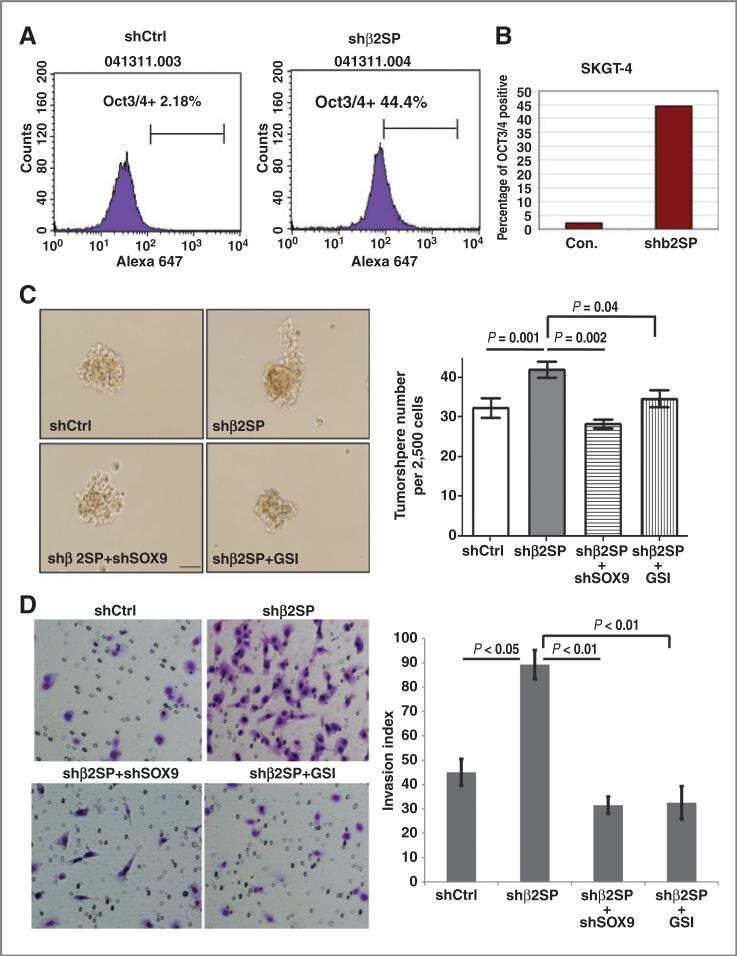
Figure 6.
Loss of β2SP increases oncogenic potential in esophageal adenocarcinoma cells. A, flow cytometry analysis using Oct3/4 antibody in esophageal adenocarcinoma cells with control or shβ2SP was conducted. B, bar graph showed the difference of OCT3/4 positive cells in control and shβ2SP cells. C, tumor sphere assays were done in SKGT-4 cells with modified β2SP and or SOX9 level as described in Materials and Methods. Representative fields are shown in C (left) and the bar graph in C (right). D, Matrigel-invasion assays were done in SKGT-4 cells (1 × 10⁵) with modified β2SP or SOX9 as indicated in Materials and Methods. Representative fields are shown in D (left) and the bar graph in D (right). Experiments conducted in triplicate; bars, standard errors, *, P < 0.05 or lower.

