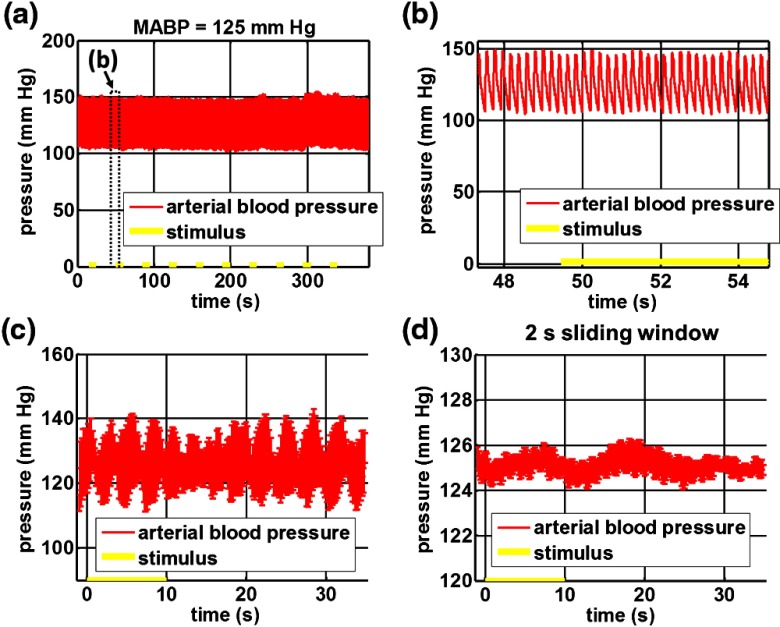
Fig. 4.
(a) Arterial blood pressure trace during a single run with 10 stimulus trials. The mean arterial blood pressure (MABP) was 125 mmHg. (b) Zoom of the boxed region in (a) shows pulsations due to the heartbeat. (c) Arterial blood pressure, averaged over all trials (), shows no systematic change in response to the stimulus. (d) Applying a 2-s sliding window filter before averaging over trials () results in comparably less variation, but still shows no systematic change in response to the stimulus. A variance reduction in flow measurements similar to that observed in (c, d) occurs when integrating velocity over the vessel cross-section during multiple heartbeats.

