
Figure 4.
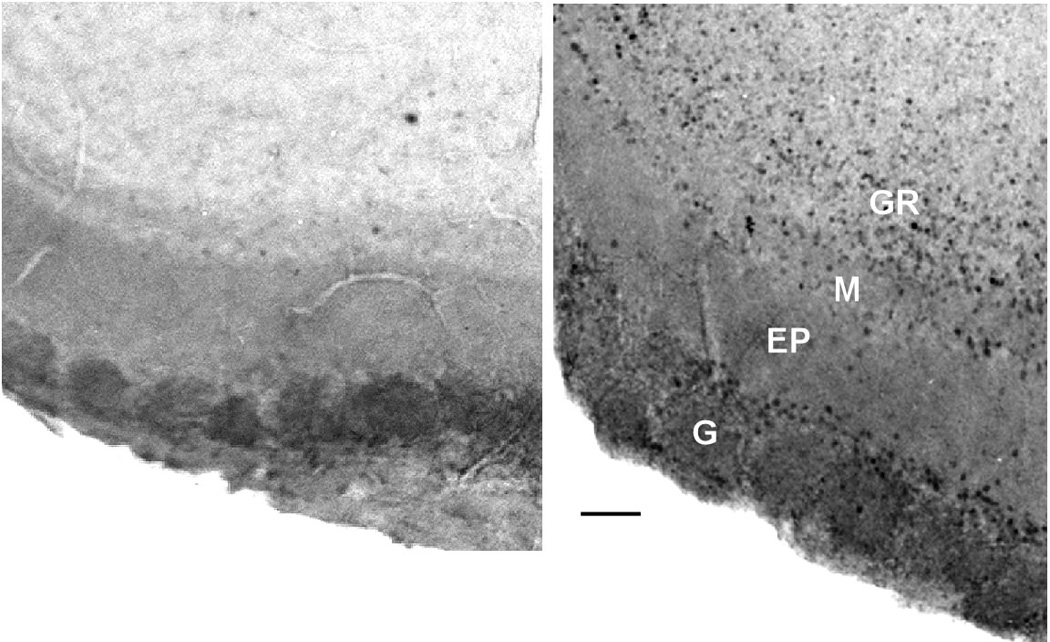
Photomicrographs showing c-Fos expression in the glomerular region from the ventromedial area of the MOB in a ZnSO4 treated (A) and saline treated mouse (B). Little or no Fos expression was found in the MOB in Zn- mice. G: glomerular layer. EP: external plexiform layer. M: mitral cell layer. GR: granule cell layer. Calibration bar: 50 microns.