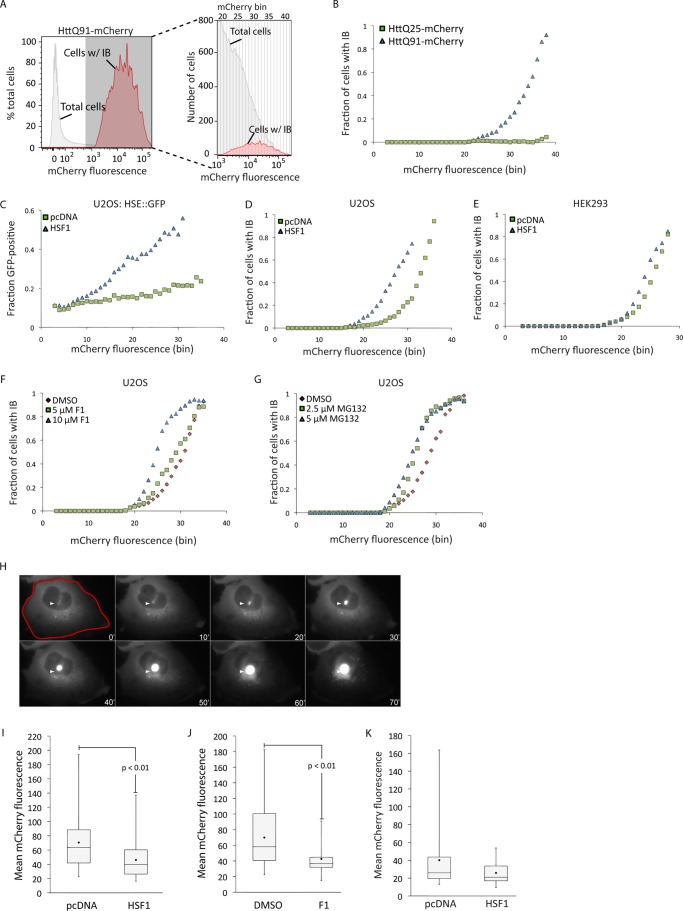
FIGURE 3.
Activation of the HSR decreases the concentration at which mutant huntingtin forms IB. A, the method used to determine the fraction of cells with IB as a function of mCherry expression. Cells with IB were identified using PulSA (red histogram), and the histogram of total mCherry fluorescence (gray histogram) was subdivided into 41 equal bins. The fraction of cells in each bin that contained IB was determined by dividing the number of cells with IB by the number of total cells in that bin (enlarged histogram, right-hand panel). Note that the y axis of the enlarged histogram reports the absolute numbers of cells, whereas the y axis of the parent histograms is normalized to the total number of cells analyzed. B, the fraction of HTT(Qn)-mCherry-expressing cells with IB was determined by PulSA and transformed from panel A. C, HSE::GFP cells were transiently transfected with HTT(Q91)-mCherry or HTT(Q91)-mCherry and HSF1, and the fraction of cells that were GFP-positive was determined as a function of their mCherry fluorescence. D–G, the fraction of HTT(Q91)-mCherry-expressing cells with IB, determined by PulSA following HSF1 overexpression (D and E) or treatment with F1 (F) or MG132 (G). H, the method used to determine the concentration at which HTT forms IB. Cells expressing HTT(Q91)-mCherry were imaged by time-lapse video microscopy, and a mask indicated in red was drawn in the frame preceding IB formation (white arrowhead). Elapsed time is indicated in minutes. I and J, effect of HSF1 overexpression (I, pcDNA: n = 43; HSF1: n = 51) or 10 μm F1 treatment (J, DMSO: n = 9; F1: n = 22) on the concentration at which HTT(Q91)-mCherry forms IB, analyzed by time-lapse video microscopy. K, effect of HSF1 overexpression (pcDNA: n = 23; HSF1: n = 26) on the concentration of HTT(Q91)-mCherry at which cells die, analyzed by time-lapse video microscopy. The black diamond in the box plots indicates mean calculated value. p values were determined by Student's t test. In I–K, error bars indicate mean ± S.D.

