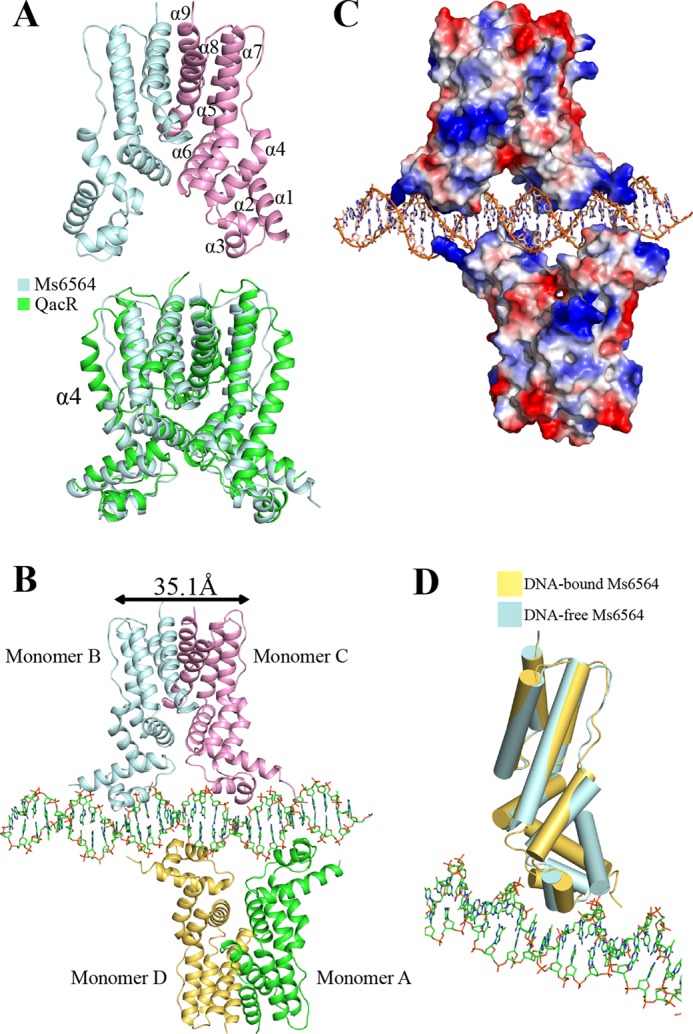
FIGURE 1.

Representation of Ms6564 and the Ms6564-DNA complex. A, structure of the Ms6564 homodimer (upper panel) compared with QacR from S. aureus (lower panel). The secondary structural elements of Ms6564 are labeled. Ms6564 and QacR are displayed in pale cyan and green, respectively. The α4 is noted. B, overall structure of the Ms6564-operator complex. Ribbons represent proteins; sticks represent DNA. The subunits of one dimer are shown as pale cyan and pink, and those of the other as yellow and green. The proximal monomers are pink and yellow, whereas the distal monomers are pale cyan and green. The center to center distance of recognition helices is 35.1 Å, and a 4-bp sequence separates Ms6564 from proximal helices. C, electrostatic surface potentials of Ms6564 upon DNA binding. The blue regions indicate positive electrostatic regions, and red regions indicate negative electrostatic regions. The positively charged N-terminal arms of Ms6564 are noted. The range in electrons between dark red and dark blue is from −77.250 to 77.250. D, structural comparison of Ms6564 with (yellow) and without (pale cyan) DNA binding. Cylinders represent proteins; sticks represent DNA.
