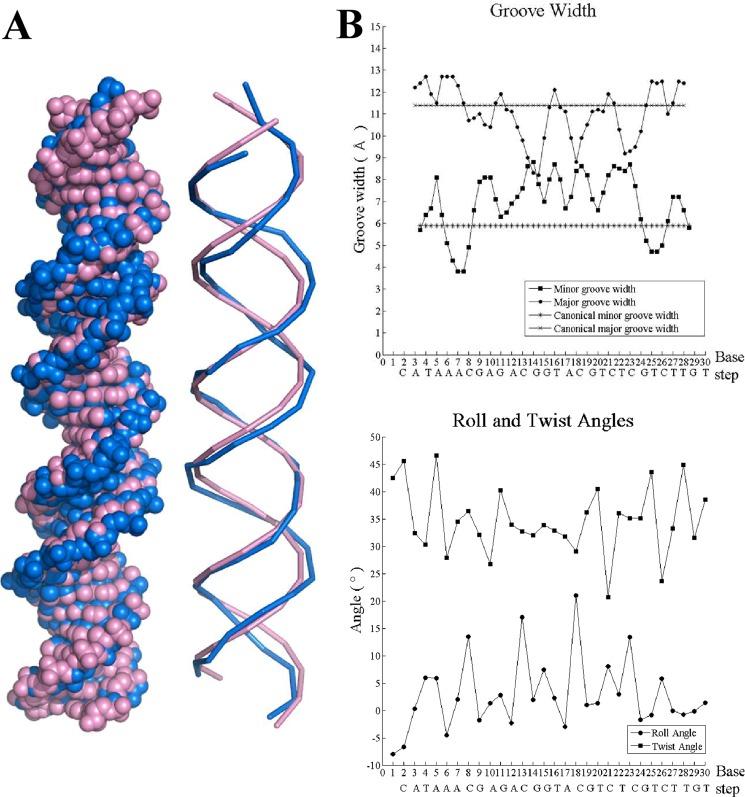
FIGURE 3.
DNA deformation in the Ms6564-DNA complex. A, Ms6564-bound DNA is highlighted by blue, and canonical B-DNA is highlighted by purple. B, the major and minor groove width of the Ms6564-bound DNA. The values for canonical B-DNA are included for comparison (upper panel). The roll and twist angle for each base pair step of the Ms6564-bound DNA is shown in the lower panel.

