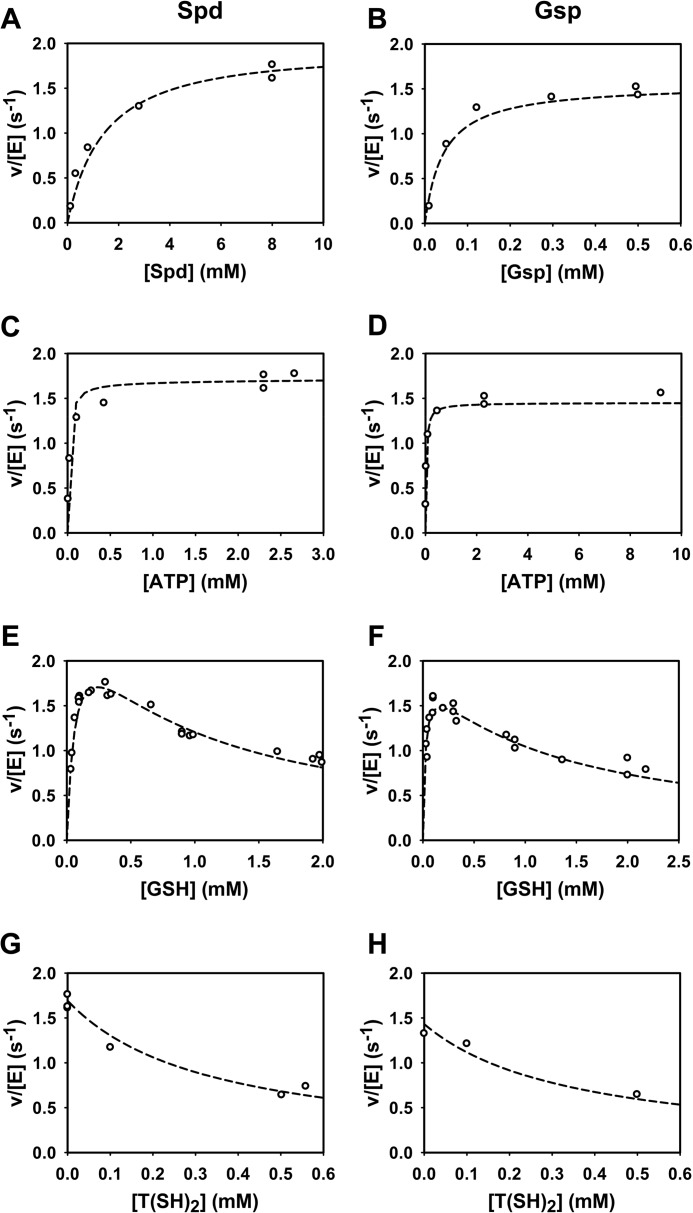
FIGURE 7.
Comparison of the model simulations with the experimental data of TryS. Kinetic profiles of various reactions were measured with Spd (left column) and Gsp (right column) as substrates. The reaction mixtures contained fixed concentrations of 2.3 mm ATP and 0.3 mm GSH (A and B), 0.3 mm GSH and 8 mm Spd (C), 0.3 mm GSH and 0.5 mm Gsp (D), 2.3 mm ATP and 8 mm Spd (E), 2.3 mm ATP and 0.5 mm Gsp (F), 2.3 mm ATP, 0.3 mm GSH, and 8 mm Spd (G), 2.3 mm ATP, 0.3 mm GSH, and 0.5 mm Gsp (H). Dashed lines are model simulations, and open circles are experimental data (see Figs. 1, 2, and 3).

