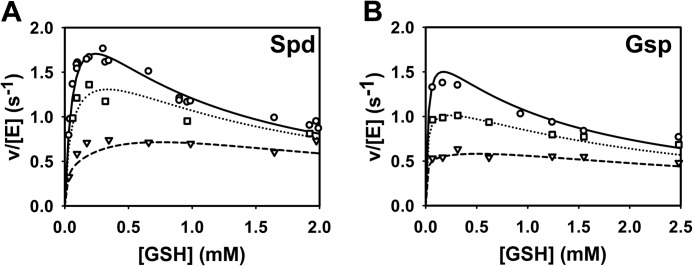
FIGURE 8.

Simulation of the T(SH)2 inhibition of TryS. The activities of TryS measured at variable GSH and T(SH)2 concentrations at fixed concentrations of 2.3 mm ATP and 8 mm Spd (A) or 0.61 mm Gsp (B) (symbols) (see Fig. 3, C and D) are depicted together with the model simulation (lines). The reactions contained 0 mm (○, solid line), 0.1 mm (□, dotted line), and 0.56 mm T(SH)2 (▿, dashed line) (A) and 0 mm (○, solid line), 0.16 mm (□, dotted line), and 0.56 mm T(SH)2 (▿, dashed line) (B).
