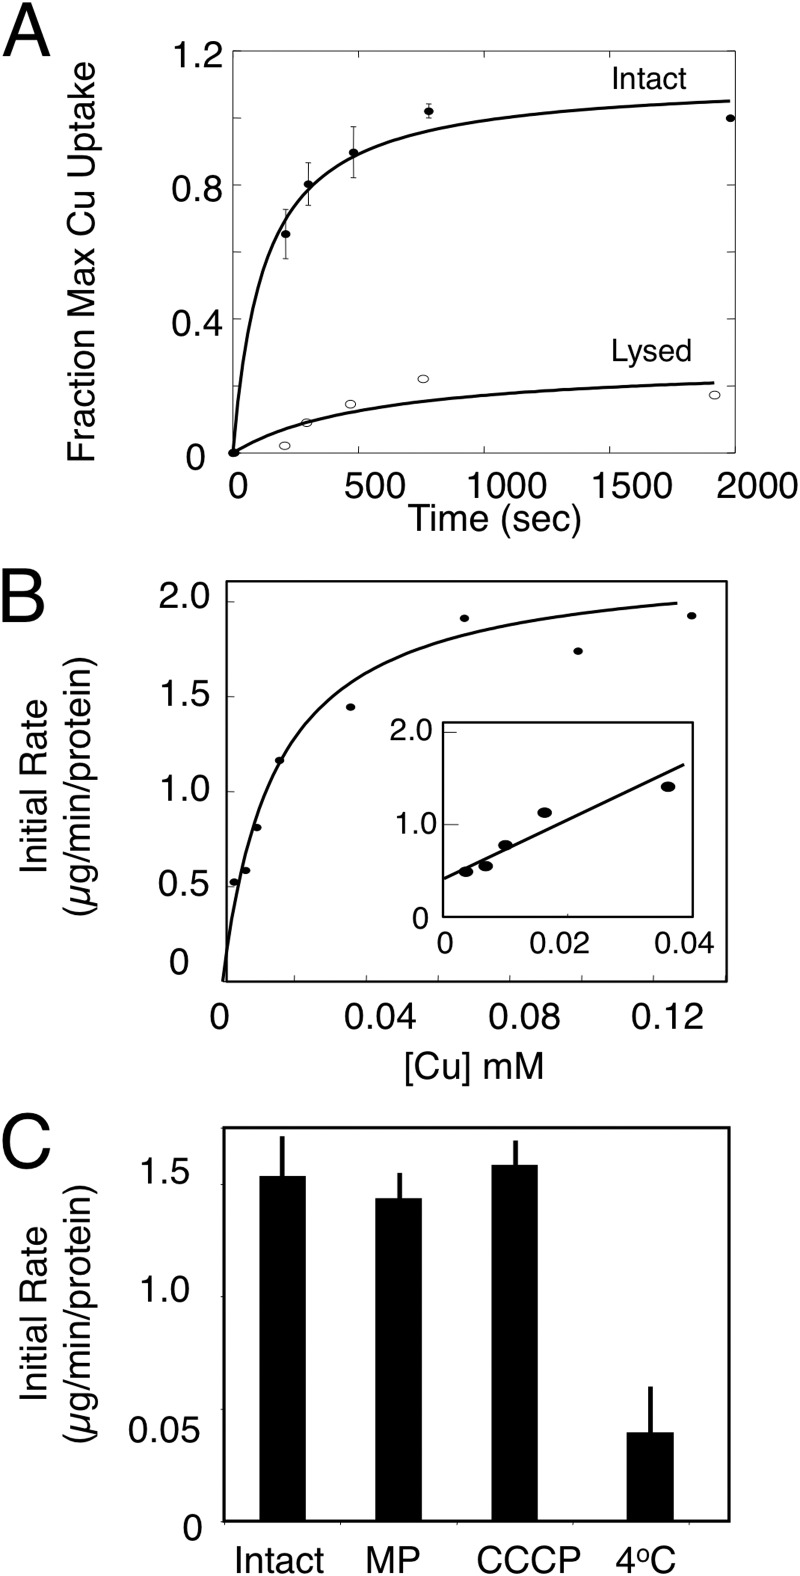
FIGURE 1.
In vitro CuL uptake in purified mitochondria. A, intact mitochondria were incubated with purified CuL and isolated by centrifugation, and copper was measured by ICP-OES. Fraction of maximal uptake is plotted versus incubation time for an average of three independent experiments with wild-type mitochondria. Error bars represent S.D. B, initial rates of uptake across a range of CuL concentrations. Data are fit by a hyperbolic curve. The inset shows the initial rate of uptake at 0–50 μm CuL and is fitted by linear regression. C, the initial rate of CuL uptake was measured by ICP-OES in intact mitochondria, mitoplasts (MP) were prepared by hypotonic lysis, and mitochondria were incubated with the uncoupler carbonyl cyanide m-chlorophenylhydrazone (CCCP) or were incubated at 4 °C. The means ± S.D. are shown for three independent experiments.

