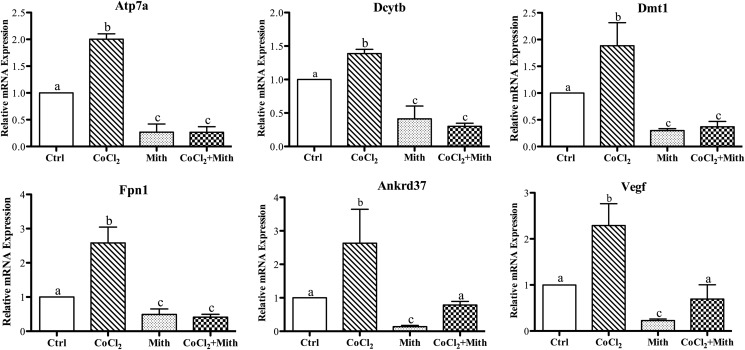
FIGURE 1.
Effect of mithramycin on CoCl2-mediated transcriptional induction. Postconfluent IEC-6 cells were cultured for 60 h in the presence or absence (Ctrl) of 200 μm CoCl2. Mithramycin (Mith) (500 nm) was added to one set of culture dishes from each treatment group for the last 24 h. Gene expression levels were subsequently determined by qRT-PCR. Gene symbols are shown in each panel. Each bar represents the mean ± S.D. (n = 3). Different letters above each bar (a, b, and c) indicate significant differences between groups within each panel (p < 0.05; one-way analysis of variance).

