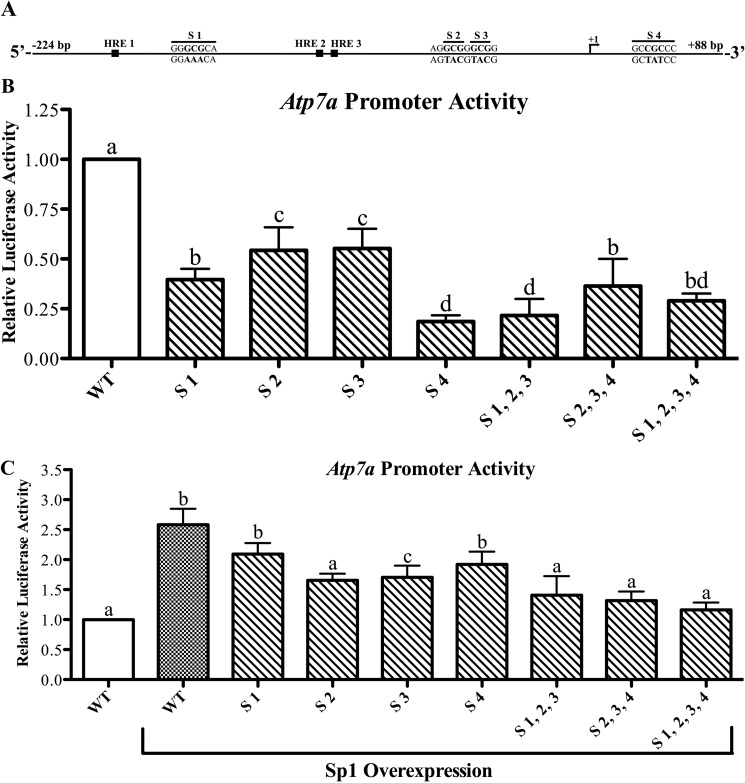
FIGURE 3.
Functional analysis of putative Sp1 binding sites on the Atp7a promoter. A shows a schematic representation of the Atp7a promoter (−224 to +88). The 5′-most transcriptional start site identified previously is marked as +1. Also shown are the previously identified HREs and the putative Sp1 binding sites (designated as S1–S4) with the mutated bases shown below the line. These putative Sp1 binding sites were mutated individually or in combination in the basal Atp7a promoter construct and subsequently transfected into IEC-6 cells. B shows the activity of mutated promoters in relation to the activity of the WT promoter. C shows the effect of forced Sp1 expression on WT and mutated Atp7a promoter activity. In B and C, each bar represents the mean value ±S.D. Different letters above bars indicate significant differences among groups (unpaired Student's t test; n = 3–4).

