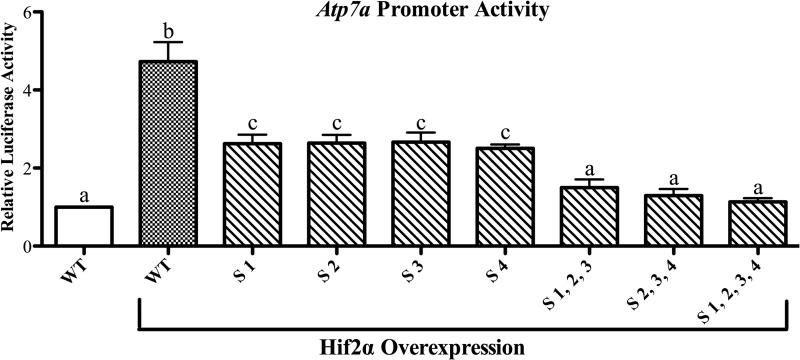
FIGURE 5.
Effect of Hif2α overexpression on Atp7a promoter activity. Hif2α expression vector was co-transfected into IEC-6 cells along with WT or mutant Atp7a promoter constructs, and luciferase assays were performed. The effect of Hif2α overexpression is shown relative to activity of the WT promoter without Hif2α overexpression. The specific Sp1 sites (S) mutated are indicated below each bar, and Hif2α overexpression is indicated further below. Each bar represents the mean value ±S.D. Different letters above bars indicate statistical differences between groups (p < 0.05; paired Student's t test; n = 3–4).

