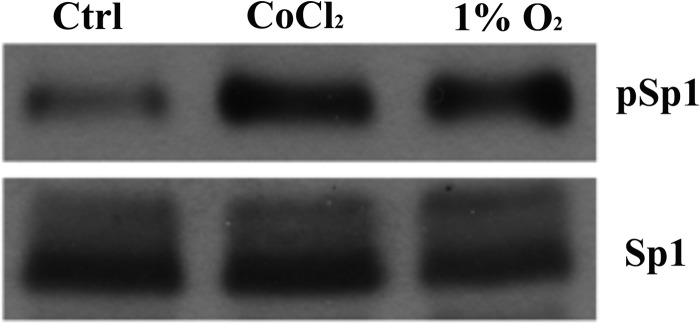
FIGURE 8.

Immunoblot analysis of phosphorylated Sp1 protein expression. IEC-6 cells at 85% confluence were either untreated and grown under control conditions (Ctrl), treated with 200 μm CoCl2, or cultured in a hypoxia chamber (with 1% O2) for 60 h. Nuclear proteins were then isolated, and immunoblots were run for detection of Sp1 and phosphorylated Sp1 (pSp1). The pSp1 band was detected at ∼120 kDa, whereas the total Sp1 protein band was detected at ∼108 kDa. The blots shown are representative of three independent experiments with comparable results.
