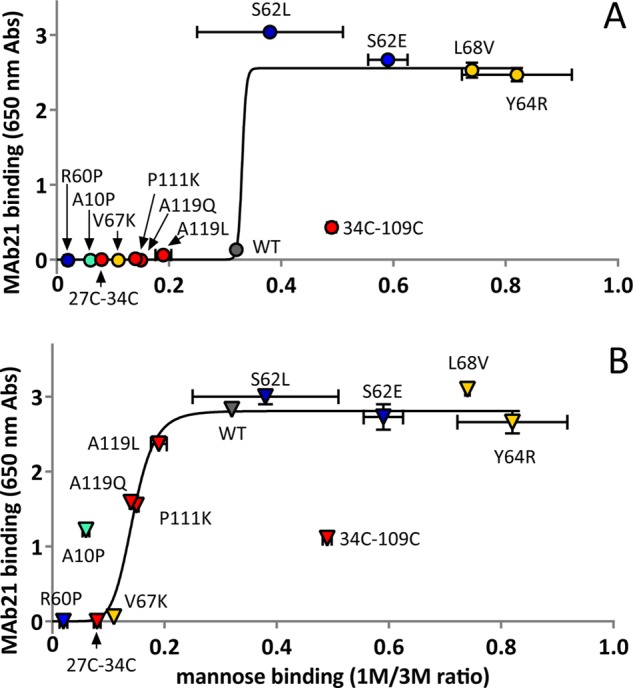
FIGURE 5.

Correlation of mannose and mAb21 binding. A, shown is the allosteric coupling between the mannose-binding site (1M/3M) and the interdomain region (mAb21), with the latter in the absence (panel A) or presence (panel B) of ligand mannose. The data and error bars are taken directly from Figs. 3B and 4. The lines show an empirical trend rather than a mechanistic model. Abs, absorbance units.
