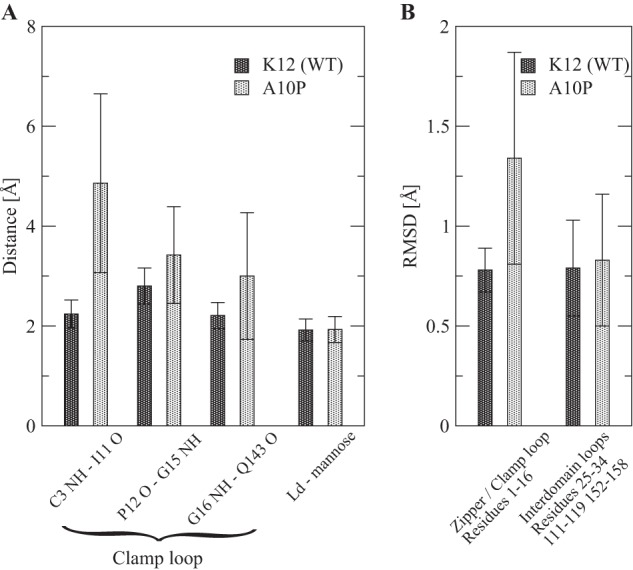
FIGURE 6.

MD simulations with WT and A10P variants. A, shown is the average distance between atoms involved in hydrogen bonds during the last 40 ns. A length less than 2.7 Å is considered a strong bond, between 2.7 and 3 Å is considered a weak bond, and over 3 Å is considered broken. B, shown is average root mean square deviation (RMSD) from the initial structure averaged over the last 40 ns for residues contained in the pocket zipper and clamp loop and for residues contained in the interdomain loops. All values are averages of the measurement taken during the last 40 ns of two 50-ns simulations. The error bars indicate S.D. over time in both trajectories in order to illustrate the fluctuations.
