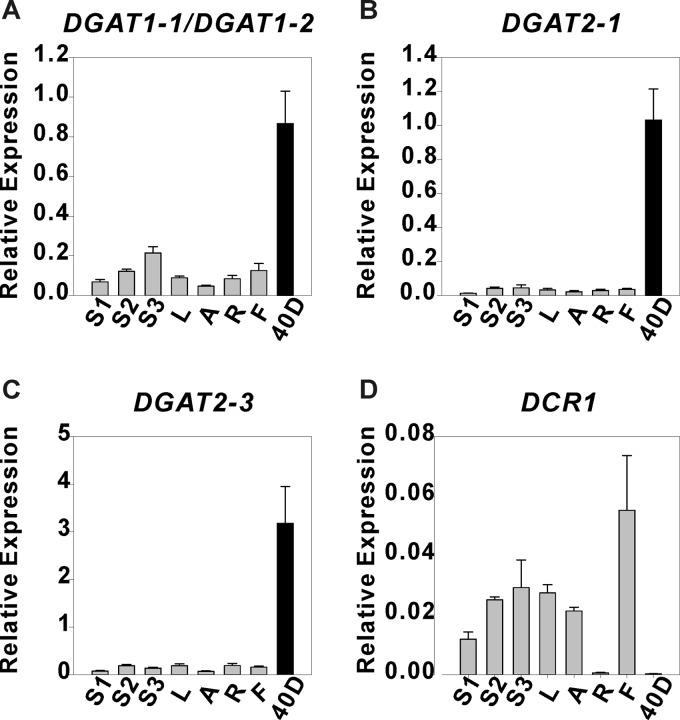
FIGURE 2.
Quantitative real-time PCR analysis of relative expression of flax DGAT genes in different tissues. The transcript levels of LuDGAT1 (A) and LuDGAT2 (B and C) genes were higher in seeds (40 DPA, black bar) than in other tissues (gray bar) and the opposite was observed for LuDCR1 (D). Data are given as mean ± S.E. (n = 3). S1, immature stem; S2, developing stem; S3, mature stem; L, leaves; A, apexes; R, roots; F, flowers; 40D, mature seeds.

