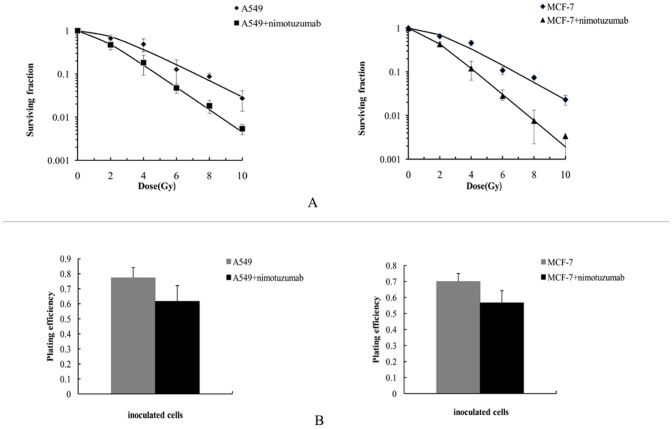
Figure 1. Dose-survival curves derived from clonogenic survival assay and the comparisons of plating efficiency.
(A) A549 cells and MCF-7 cells were preincubated with and without 700 nM nimotuzumab for 24 h, and then radiated with doses of ionizing radiation between 2 and 10 Gy. After10–14 days, the colonies were stained and counted. Surviving fractions were calculated based on colony counts and plating efficiency. Data were shown as Mean ± SD from three independent experiments. Curves were fitted with SF = 1−(1−e−D/D0) N. (B) Plating efficiency of A549 cells and MCF-7 cells. Plating efficiency = (mean number of colonies)/(the number of inoculated cells, which were pretreated with or without nimotuzumab). There were no statistical significances between nimotuzumab pretreated A549/MCF-7 cells and control, with P: 0.256, and 0.063, respectively.

