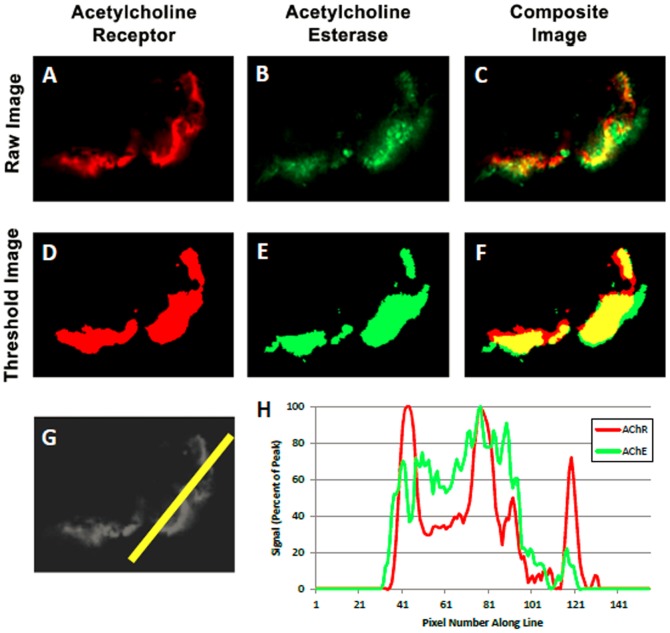
Figure 1. Determination of appositional score.
Sample images are shown for a single NMJ from a spinalis biopsy of a child with CP. The distribution of AChR (Panel A), AChE (B), and the composite image of both AChR and AChE (C) are shown. Each image was thresholded using the standard algorithm provided in the Image Pro Software, which objectively identifies foreground versus background pixels based on the distribution of intensities in the image, resulting in images D, E, and F. Distinct boundaries were reproducibly identifiable relative to background using this approach. A line drawn through the NMJ (G) provided the corresponding histogram (H) which displayed the intensities of AChR and AChE staining across the NMJ. The pixels above the preset threshold levels were categorized and counted to determine appositional scores.

