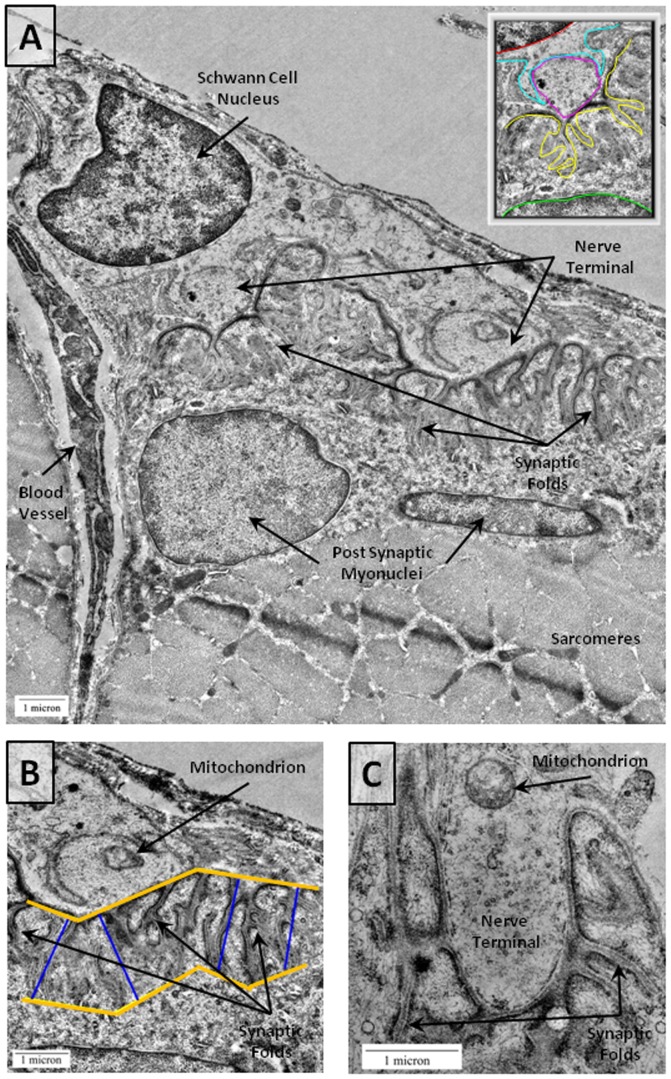
Figure 4. NMJs from CP Patients by Electron Microscopy.
A) Top panel shows an electron micrograph of a CP NMJ. A zoomed out image is shown in the upper right corner with a red line marking a Schwann cell nucleus, cyan marking the Schwann cell membrane, magenta marking the nerve terminal, yellow marking the postsynaptic folds, and green marking the postsynaptic nucleus. Scale bars = 1 µm. B) A zoomed image of primary folds in the CP NMJ is also shown. The blue lines indicate the general depth of postsynaptic fold penetrance into the muscle. For data analysis, each fold was measured separately using ImageJ software to draw trace lines for individual folds following the methods outlined by Banks et al. [27]. C) A CP NMJ with a single mitochondrion in the nerve terminal (arrow). The total area occupied by mitochondria was calculated with ImageJ software by tracing each mitochondrion segment and measuring the summed mitochondrial area relative to the total area of the terminal.

