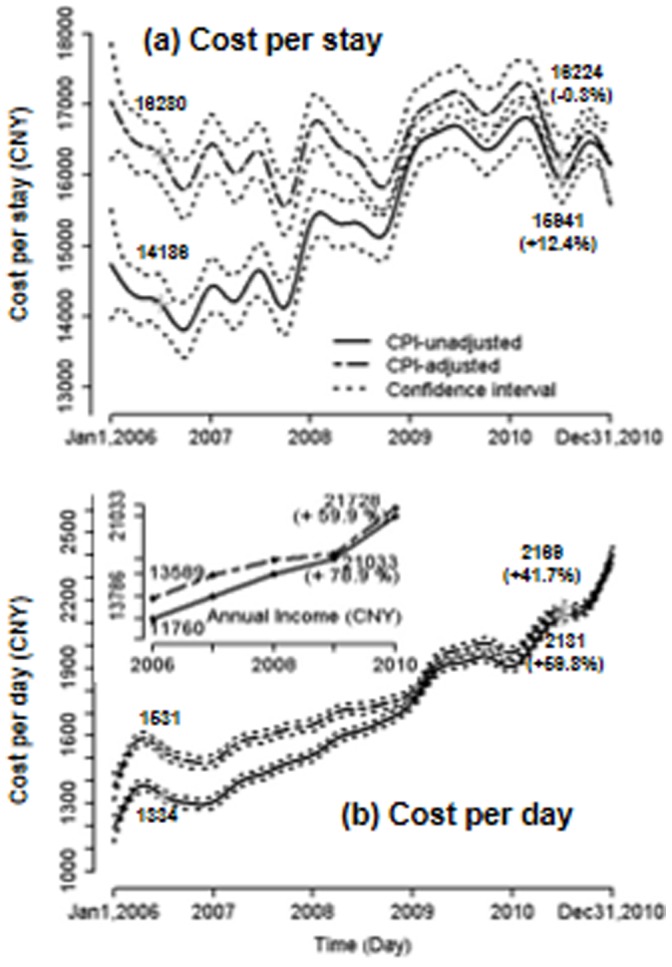
Figure 1. (a) Cost per stay, and (b) Cost per Day between 2006 and 2010 in the 3 teaching hospital.

All costs displayed are for an individual hospitalization. For comparison, national annual income per head is embedded in Figure 1b.

All costs displayed are for an individual hospitalization. For comparison, national annual income per head is embedded in Figure 1b.