
Figure 6. Phenotypic characteristics of BM-DCs stimulated with T4 phage.
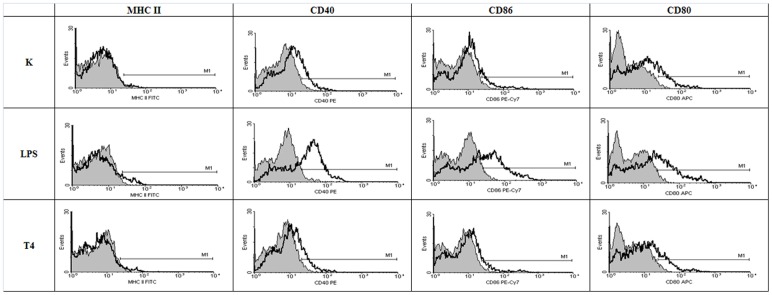
MFI (mean fluorescence intensity) was presented for the isotype control (shadowed gray histogram) vs the examined surface antigen (black). This figure presents results from one of three experiments. K – control.