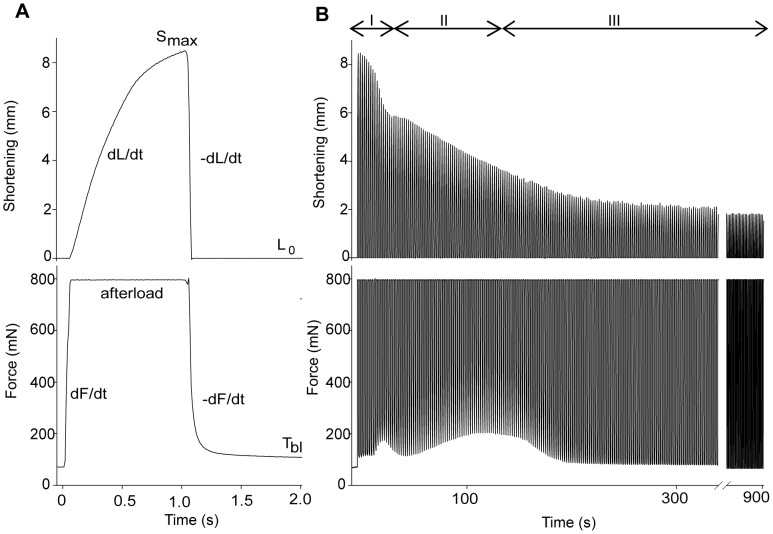
Figure 2. Representative tracings of shortening and force in the 15 min exercise protocol (1st bout).
Tracings of shortening (upper panel) and force (lower panel). A) The in vivo prepared muscle was stimulated intermittently with 1s on, 1s off. As stimulation starts, force rises from resting base line tension (Tbl) until it reaches the pre-set afterload (33% of Fmax). From here, the force is maintained while the muscle starts to shorten and reaches the maximal shortening (Smax). When stimulation ceases (after 1 s) the muscle is passively stretched to resting length (L0), and subsequently force declines. B) Representative tracing of a 15 min exercise protocol (1st bout). Note the three phases marked with roman numbers; during the first 20 s exercise there is a prominent fall in Smax (upper panel); at 100 s there is a further reduction in Smax accompanied by a transient rise in Tbl (lower panel); at 15 min there is still reduction in Smax while Tbl is restored to initial values.

