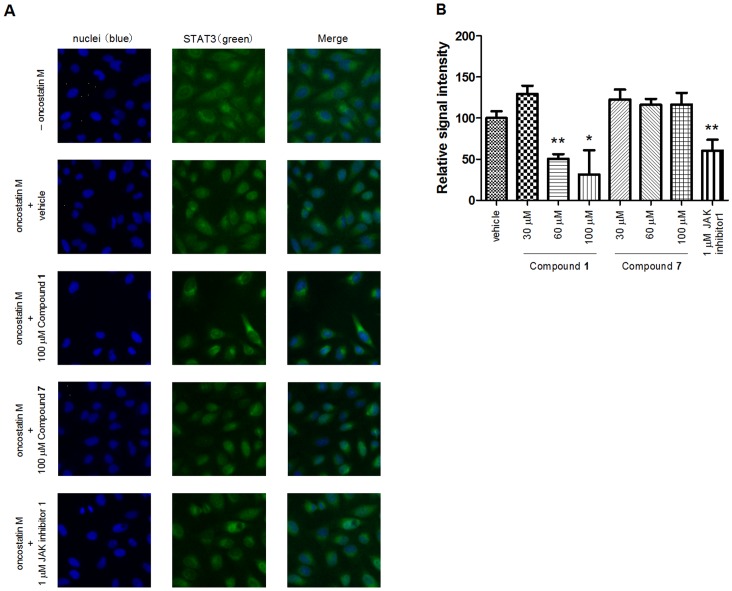
Figure 6. Inhibition of the STAT3 nuclear translocation by Compound 1 in HeLa cells.
(A) Fluorescence images of the STAT3 proteins in the nuclei of HeLa cells. The HeLa cells were pretreated with or without the test compounds, and then either treated with oncostatin M or left untreated. The cell nuclei were stained with Hoechst 33342 and the STAT3 proteins were visualized with anti-STAT3 antibody. The merged image showed the fusion of blue (nuclei) and green (STAT3) fluorescence. The test compounds treated are shown in the figure. The cells treated with neither oncostatin M nor the test compounds are shown as “–oncostatin M”. (B) Dose-dependent inhibition of the STAT3 nuclear translocation by Compound 1. The mean fluorescent values of STAT3 in the nuclei were calculated. The signals with oncostatin M but not the test compounds (“vehicle”) and “–oncostatin M” were used for the 100% and 0% signals, respectively. The relative signal intensity was calculated in each well. Each point represents the mean from three replicates, and the error bars represent the standard deviation from the mean (*P<0.05 and **P<0.01 versus vehicle in Student’s t-test). JAK inhibitor 1 was used as a positive control.

