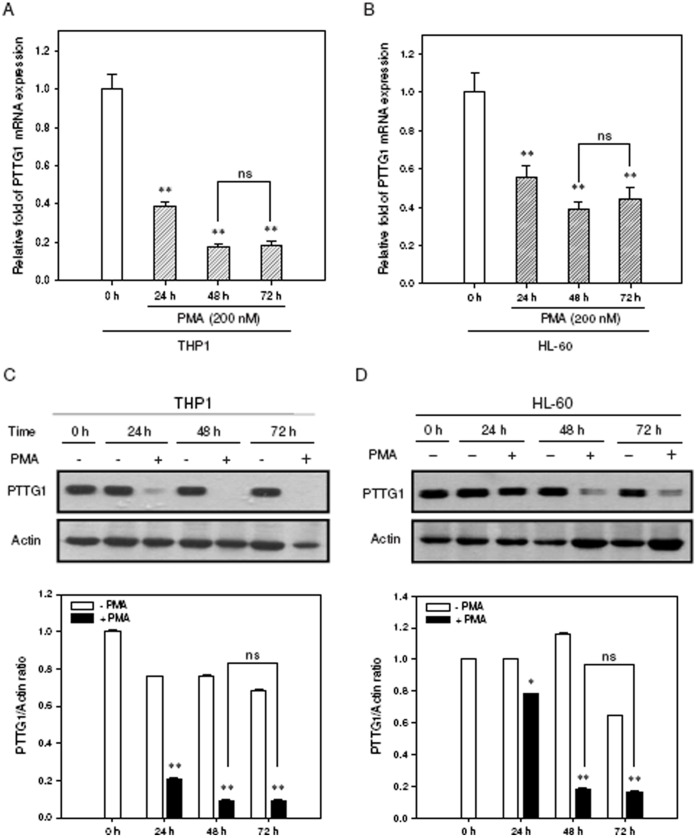
Figure 3. PTTG1 expression is down-regulated during PMA-induced cell differentiation.
Total cellular RNA was extracted and PTTG1 mRNA expression was determined by qRT-PCR in (A) THP1 and (B) HL-60 cells treated with PMA (200 nM) for indicated periods. Data represent the mean ± SD from five independent experiments. **p<0.01 represents significant differences compared with the 0 h group. ns represents no significance. Western blot analysis was performed to detect PTTG1 and actin proteins in (C) THP1 and (D) HL-60 cells. The immunoblot experiments were replicated at least three times, and a representative blot is shown. The normalized intensity of PTTG1 versus actin is presented as the mean ± SD of three independent experiments. *p<0.05 and **p<0.01 represents significant differences compared with the 0 h group. ns represents no significance.

